
Figure 2.
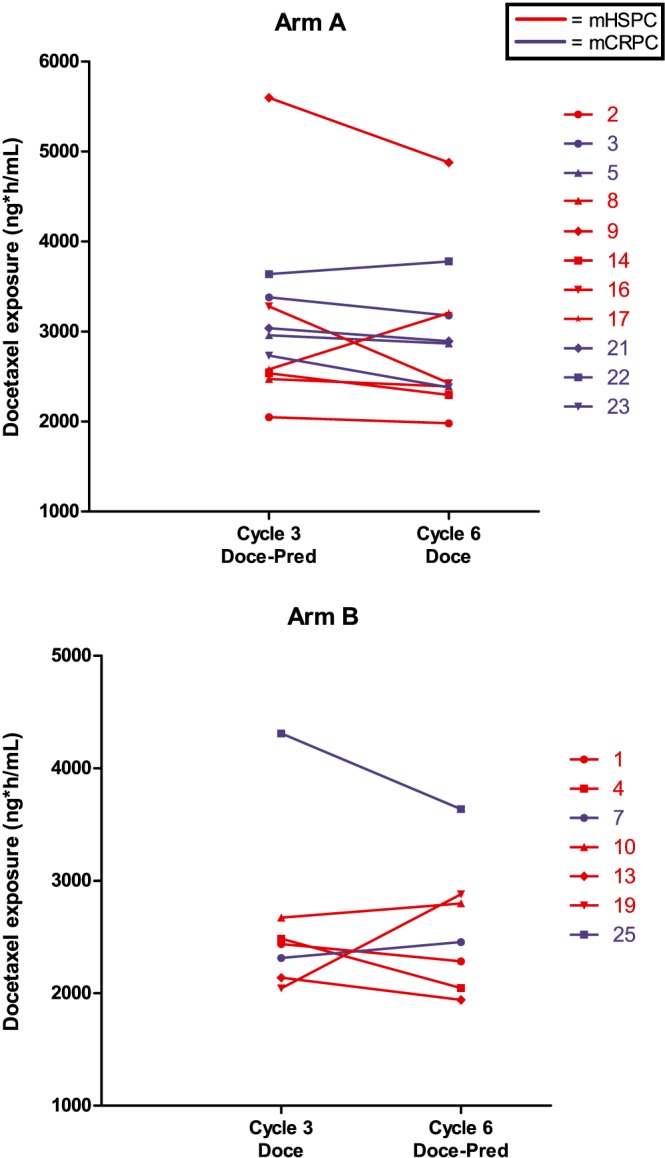
Docetaxel concentration by disease setting. Each line represents a patient for whom the measured docetaxel concentration (geomean AUC0‐inf) during cycle 3 and cycle 6 were connected with a line to visualize the differences in the cycles. In the majority of the patients the measured concentration in cycle 6 is lower than in cycle 3, reflecting the period‐effect observed in this study