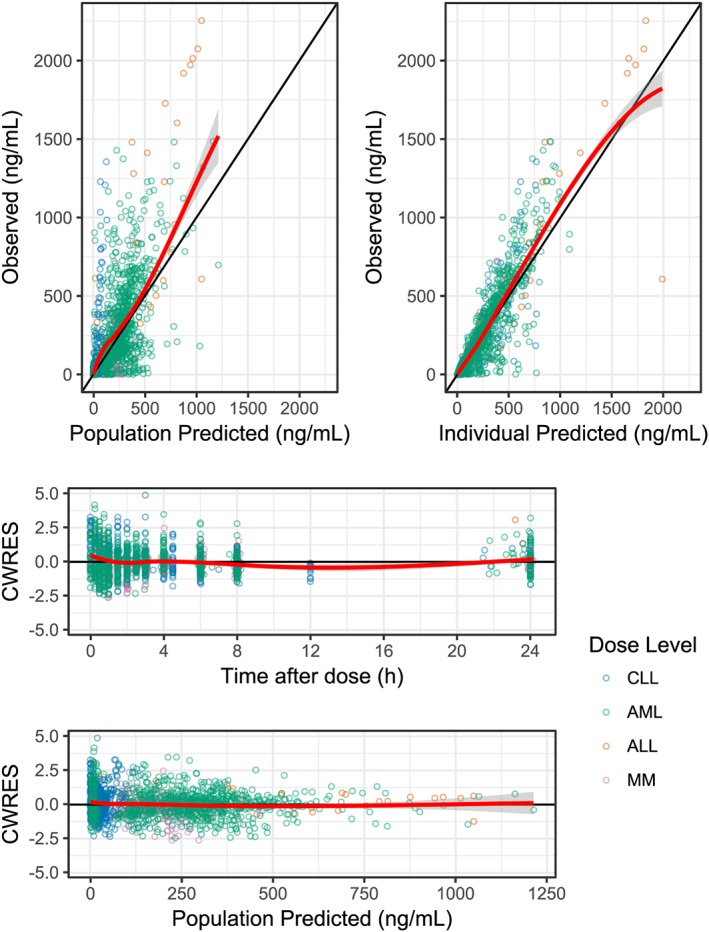
Figure 2.

Goodness‐of‐fit plots both comparing observed concentrations with population and individual predicted concentrations and observing conditional weighted residuals (CWRES) over time and across population predicted concentrations. The data points are coloured according to the cancer type as shown in the legend. The red line represents the loess smoothed mean, with the grey ribbon representing the 95% confidence intervals of the smooth. ALL, acute lymphoblastic leukaemia; AML, acute myeloid leukaemia; CLL, chronic lymphocytic leukaemia; MM, multiple myeloma
