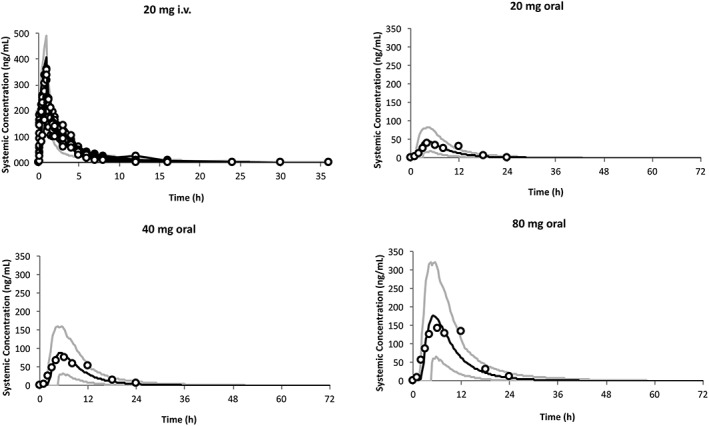
Figure 2.

PK profiles in the non‐pregnant population. Simulation (mean predictions in black lines and 5th–95th percentiles of predictions in grey lines) of PK profiles for an i.v. administration of 20 mg infused over 1 hour and for oral administrations of 20, 40 and 80 mg of ziprasidone (under fed conditions). Simulations were compared with observed clinical data (circle) from 20 mg i.v. administration,31 20, 40 and 80 mg oral administration44
