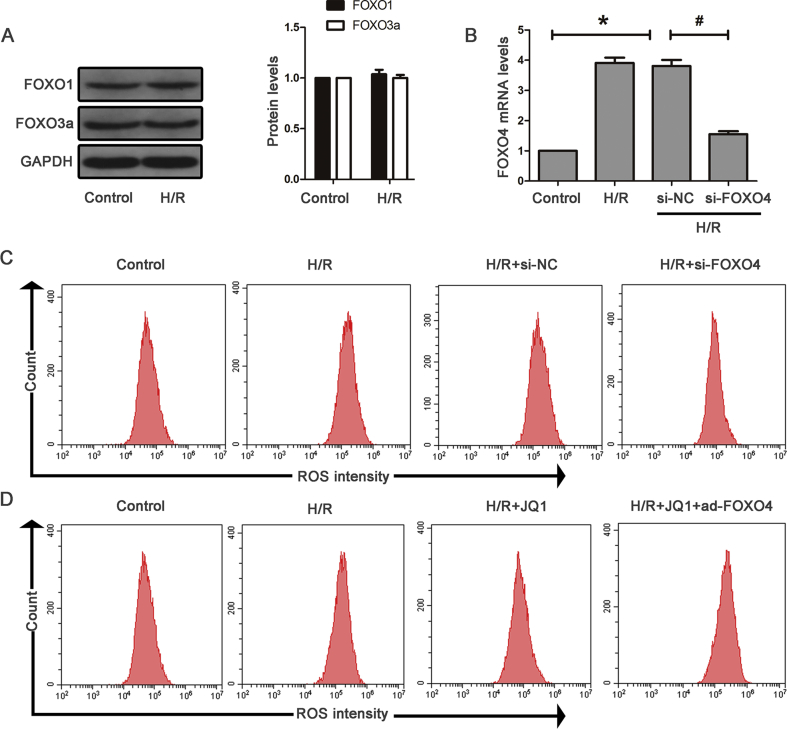
Fig. S4.
(A) Western Blot analyses for protein expression of FoxO1 and FoxO3a in indicated groups (n = 3). (B) Real-time PCR analyses for expression of FOXO4. (C) ROS production was measured by flow cytometry. (D) Adenovirus carrying human FoxO4 compensates the reduction of ROS induced by JQ1. Flow cytometry was performed to measure ROS production.

