
Figure 2.
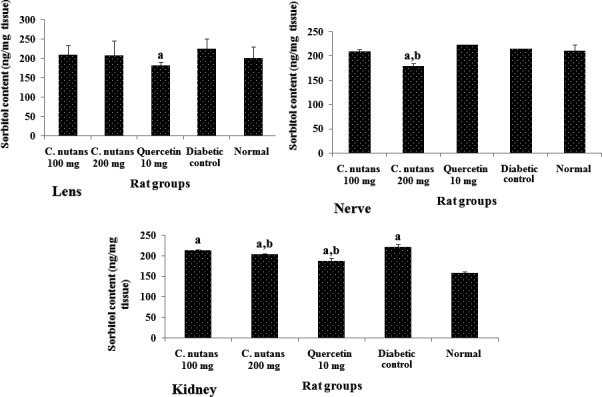
Sorbitol contents of the lens, nerve, and kidney at 4 weeks of intervention in T2D rats. Groups are the same as in Table 1. aindicates a statistical difference in comparison with the normal group for either glucose or weight measurements in each column (p < 0.05). bindicates a statistical difference in comparison with the diabetic control group for either glucose or weight measurements in each column (p < 0.05)