
Figure 8.
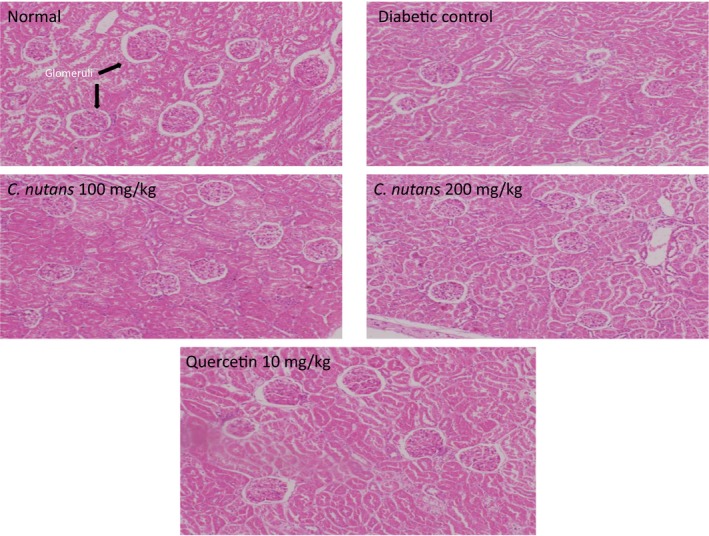
Kidney histology at 4 weeks of intervention in T2D rats. 10x Magnification. Groups are the same as in Table 1
Official websites use .gov
A
.gov website belongs to an official
government organization in the United States.
Secure .gov websites use HTTPS
A lock (
) or https:// means you've safely
connected to the .gov website. Share sensitive
information only on official, secure websites.
Kidney histology at 4 weeks of intervention in T2D rats. 10x Magnification. Groups are the same as in Table 1