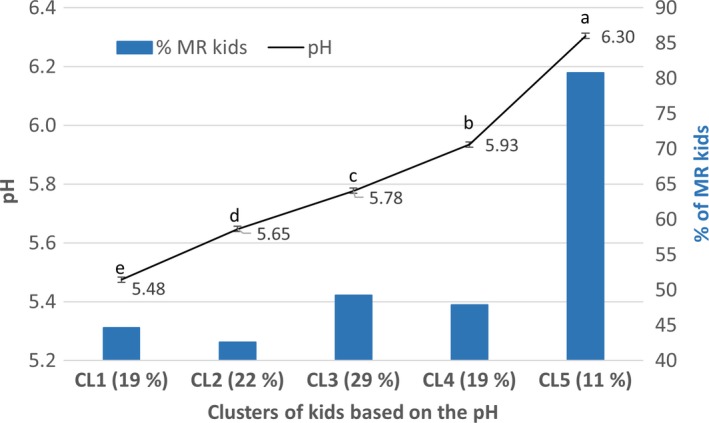
Figure 2.

Clusters of kids based on the pH and percentage of milk replacer (MR) kids within each cluster. The percentage of kids per cluster is between brackets. The observed frequency of kids fed MR within the CL5 cluster was greater (p < 0.05) than the expected frequency (χ2 = 9.48; p < 0.05). Different superscripts indicate significant differences in pH between clusters (p < 0.05)
