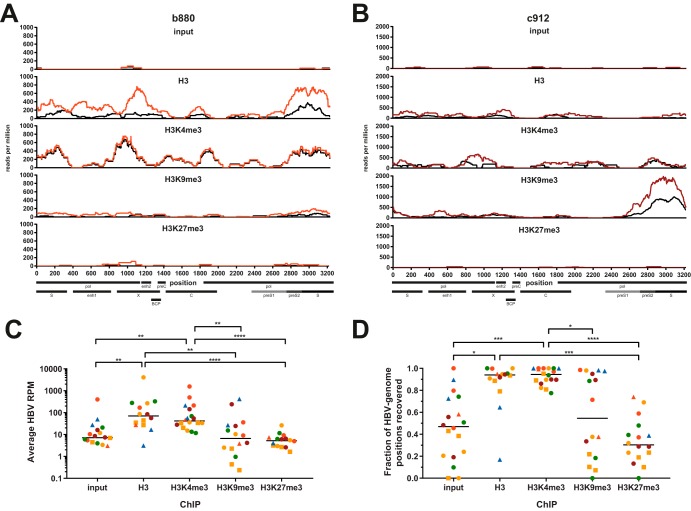
FIG 3.
Reproducible detection of HBV-derived reads from liver biopsy specimens. (A and B) Sequencing tracks showing the distributions of HBV-derived reads across the HBV genome for samples b880 (A) and c912 (B). Colored and black tracks depict sequencing results from two independently constructed libraries expressed as reads per million (RPM), i.e., HBV-specific reads per position normalized to 106 total reads. The ChIP performed is indicated above the sequencing tracks. Select genomic features and open reading frames (ORFs) are indicated at the bottom. BCP, basal core promoter; enh, enhancer; pol, polymerase. (C and D) Average HBV RPM (C) and percentage of genomic positions recovered by sequencing (D) under each ChIP condition. One data point each for the input, H3K9me3, and H3K27me3 is not displayed in panel C since zero HBV-derived reads were recovered. H3K27me3-ChIP results from samples c357 and c770 were excluded from panels C and D due to poor quality of reads mapping to the human genome. Color coding throughout the figure indicates the disease stage according to Table 1. Squares indicate samples with low-quality sequencing results after both H3K4me3-ChIP as well as H3-ChIP (samples c162, c317, and c687), and triangles indicate samples with low quality after total H3-ChIP (samples c23, c537, and c770). All P values were calculated by a Kruskal-Wallis test followed by Dunn’s multiple-comparison test. *, P < 0.05; **, P < 0.01; ***, P < 0.001; ****, P < 0.0001.

