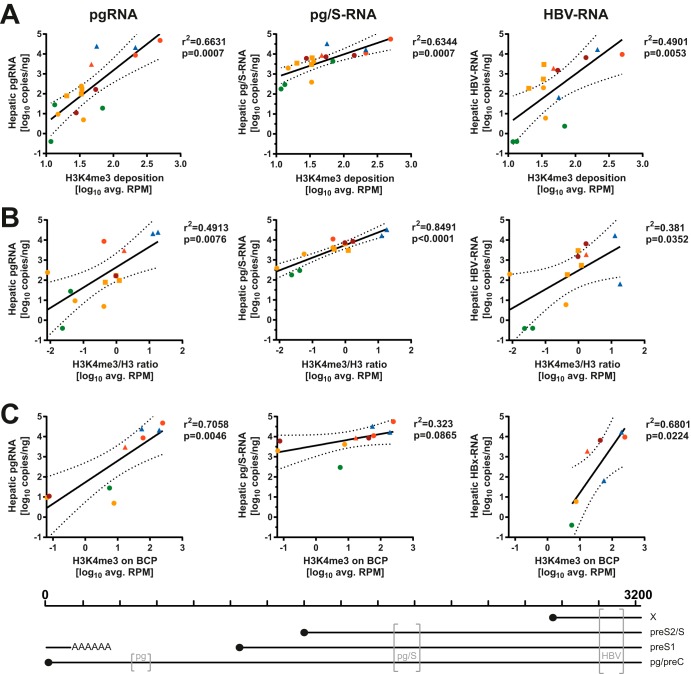
FIG 5.
H3K4me3 deposition on HBV-DNA correlates with viral transcription. Average HBV RPM after H3K4me3-ChIP (A), ratios of H3K4me3 RPM/total H3 RPM (B), and average HBV RPM mapping to the BCP (C) are displayed in relation to viral transcripts determined by primers in the core locus (pgRNA) (left), S locus (pg/S-RNA) (middle), and X locus (HBV-RNA) (right). Pearson correlation coefficients and P values for the linear regression are displayed, and the dashed lines indicate the 95% confidence interval of the linear regression. Color coding indicates disease stage according to Table 1. Squares indicate samples with low-quality sequencing results after both H3K4me3-ChIP as well as H3-ChIP (samples c162, c317, and c687), and triangles indicate samples with low quality after total H3-ChIP (samples c23, c537, and c770). Samples marked by squares were excluded in panel C to not bias localized analysis with low-quality sequencing results. The positions of the primer pairs (gray brackets) relative to the HBV genome and the transcripts measured by each pair are indicated at the bottom.

