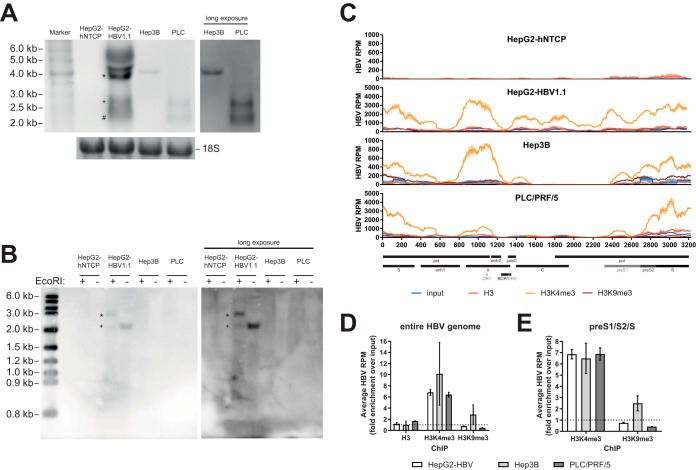
FIG 7.
Analysis of histone PTMs in cell lines with integrated HBV-DNA. (A) Northern blot of 10 μg total RNA per lane. The inset on the right shows a longer exposure of the same blot for Hep3B and PLC/PRF/5 (PLC) cells. The bottom inset shows methylene blue staining of 18S rRNA as a loading control. *, pregenomic RNA (∼3.5 kb); +, preS1 mRNA (∼2.4 kb); #, S mRNA (∼2.1 kb). Representative images from three independent experiments are shown. (B) Southern blot of 50 μg Hirt DNA per lane. All samples were denatured at 85°C prior to incubation at 37°C for 1 h with or without EcoRI, as indicated. The right panel shows a longer exposure of the same blot. *, linearized cccDNA (∼3.2 kb); +, cccDNA (∼2.1 kb). Representative images from two independent experiments are shown. (C) HBV-derived reads in the input, H3-ChIP, H3K4me3-ChIP, and H3K9me3-ChIP samples for four different cell lines. Select genomic features and ORFs are indicated at the bottom. (D) Fold enrichment over the input of averaged HBV RPM for HepG2-HBV1.1, Hep3B, and PLC/PRF/5 cells after the different ChIPs. Data are averaged from two independent sequencing runs. The dashed line indicates the level of input. (E) Bar diagram of average fold enrichment of HBV RPM over the input for the preS1/preS2/S locus after ChIP for H3K4me3 and H3K9me3. The dashed line indicates the level of input.

