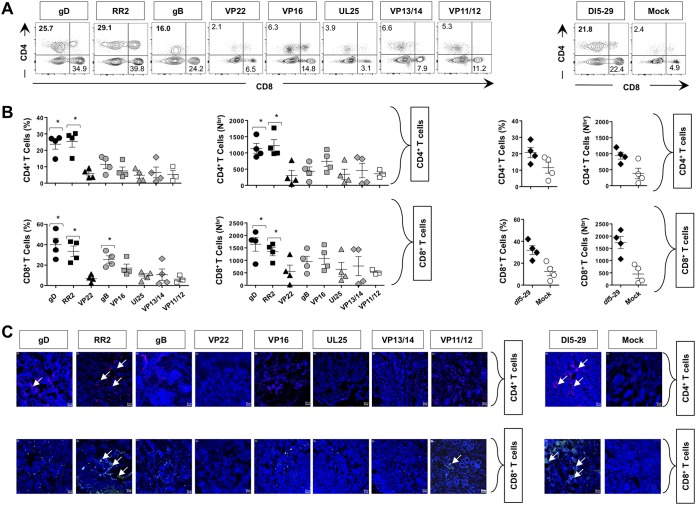
FIG 4.
Frequency of CD4+ and CD8+ T cells in the vaginal mucosae of HSV-2-infected guinea pigs following therapeutic vaccination with gD, RR2, VP22, gB, VP16, VP13/14, VP11/12, and UL25 proteins. (A) Representative FACS data for the frequencies of CD4+ and CD8+ T cells detected in the VM of vaccinated and mock-vaccinated animals. (B) Quantification of VM-resident CD4+ and CD8+ T cells following therapeutic vaccination with various HSV-2 Antigens. Average frequencies and absolute numbers of CD4+ T cells (top graphs) and CD8+ T cells (bottom graphs) were determined using FACS in the VM of vaccinated and mock-vaccinated animals. Cells were analyzed using a BD FACSCalibur flow cytometry system with a total of 4 × 10⁵ events. Density plots showing the percentage of CD4+ T cells and CD8+ T cells are representative of results from two independent experiments. The indicated P values, obtained by 2-way ANOVA for repeated measures followed by Bonferroni’s posttest for significance, show statistical significance between HSV-2-vaccinated and mock-vaccinated control groups. *, P < 0.05 (considered significant). (C) Visualization of CD4+ and CD8+ T-cell infiltration, using fluorescence microscopy, within the vaginal mucosae of HSV-2-infected guinea pigs following therapeutic vaccination with various HSV-2 antigens. Sections of the vaginal mucosa from vaccinated and mock-vaccinated animals were costained using MAbs specific to CD4+ T cells (red), CD8+ T cells (green), and 4′,6-diamidino-2-phenylindole (DAPI; DNA stain) (blue).

