Figure 3.

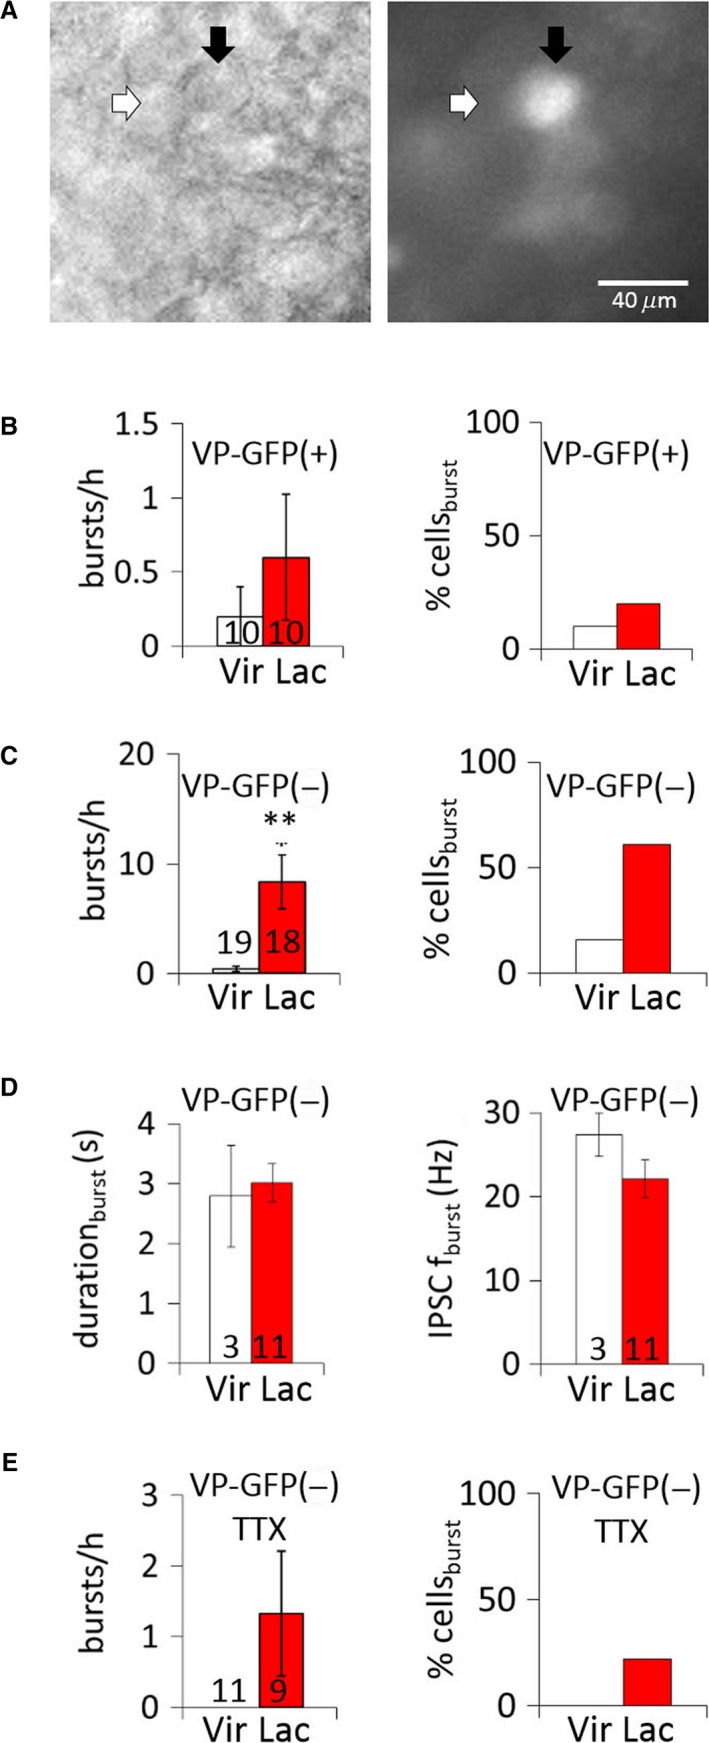
IPSC bursts in VP and putative OT MNCs during lactation. (A) Pair of MNCs viewed under IR‐DIC (left) and epifluorescence illumination (right). White arrow denotes a GFP(‐), putative OT neuron; black arrow denotes a GFP (+) VP neuron. (B) Average IPSC burst incidence (bursts/h) and percent of cells displaying bursts (% cellsburst) in GFP(+) VP MNCs from virgin and lactating rats. (C) Average IPSC burst incidence (bursts/h) and percent of cells (% cellsburst) displaying bursts in GFP(‐), putative OT MNCs from virgin and lactating rats. (D) Mean IPSC burst duration and intra‐burst IPSC frequency (IPSC fburst) in GFP(‐), putative OT MNCs from virgin and lactating rats. (E) Average IPSC burst incidence (burst/h) and percent of cells displaying bursts (% cellsburst) in VP‐GFP(‐), putative OT‐MNCs from virgin and lactating rats in TTX. **, P < 0.01.
