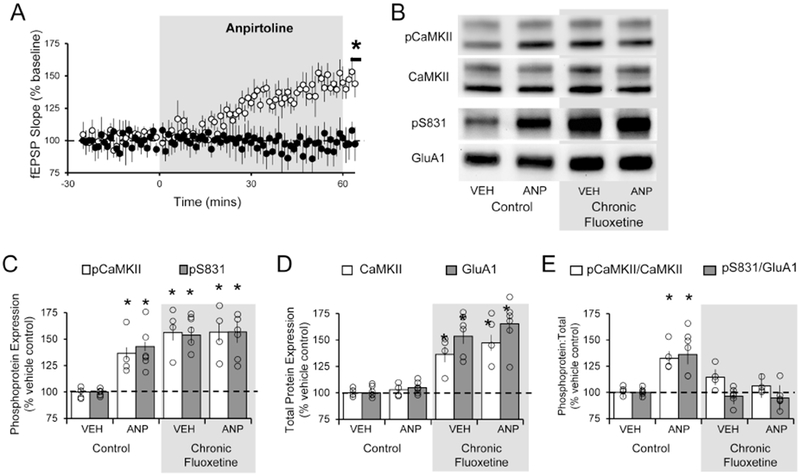
Figure 2. Chronic fluoxetine prevents acute 5-HT1BR-mediated potentiation and activation of second messenger cascade.

The effect of acute anpirtoline treatment (60min; 50 μM) on TA-CA1 fEPSPs in slices taken from untreated controls and rats subjected to 4 weeks of chronic fluoxetine. (A) Student’s t-test revealed anpirtoline failed to induce a significant increase in fEPSP slope after fluoxetine treatment (black; n = 6) but did in slices derived from control animals (white; n = 6; t(10) =8.761; p < 0.0001). (B) Example Western blots for various proteins across the different treatment conditions. (C) One-way ANOVA and post hoc analysis revealed that anpirtoline significantly increased the levels of phosphorylated CaMKII (white; [F(3,12) = 18.95; p < 0.0001]) and phosphorylated S831 of GluA1 (grey; [F(3,20) = 13.73; p < 0.0001]) at the 60min time point in control slices. Following fluoxetine treatment, levels of phosphorylated CaMKII and S831 were higher than in control slices, but anpirtoline did not further increase them. (D) One-way ANOVA and post hoc analysis revealed that expression of CaMKII (white; [F(3,12) = 17.53; p = 0.0001]) and GluA1 (grey; [F(3,20) = 20.94; p < 0.0001)] were significantly elevated following chronic fluoxetine treatment, compared to untreated controls, but expression was not further increased by anpirtoline. (E) The ratio of phosphorylated CaMKII and S831 to total CaMKII (white; [F(3,12) = 4.585; p = 0.0232]) and GluA1 (grey; [F(3,20) = 6.261; p = 0.0036]) at protein were significantly elevated following chronic fluoxetine treatment in control slices but not in slices treated with fluoxetine. * = p < 0.05 compared to untreated vehicle control; Western blot group data represents the average of a minimum of 3 replicates; data are expressed as the mean ± SEM and normalized to vehicle treated control tissue.
