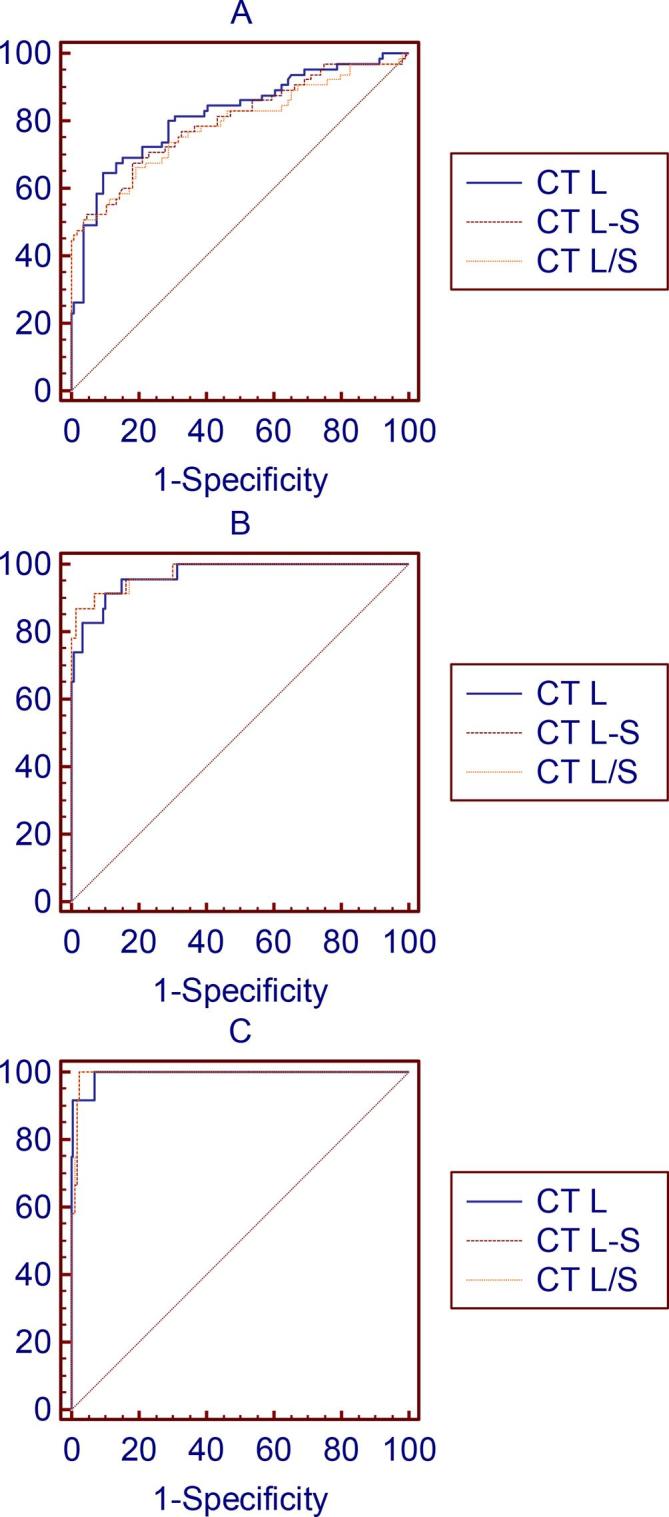
Figure 4.

Receiver operating characteristic curve of hepatic attenuation (CT L), the ratio of hepatic attenuation to splenic attenuation (CT L/S), and hepatic-splenic attenuation difference (CT L-S), established using the cut-off values for the diagnosis of steatosis (hepatic fat content of 5–10% (A), 10–15% (B), and 15–30% (C) on mDIXON-Quant MRI).
