Fig. 2.

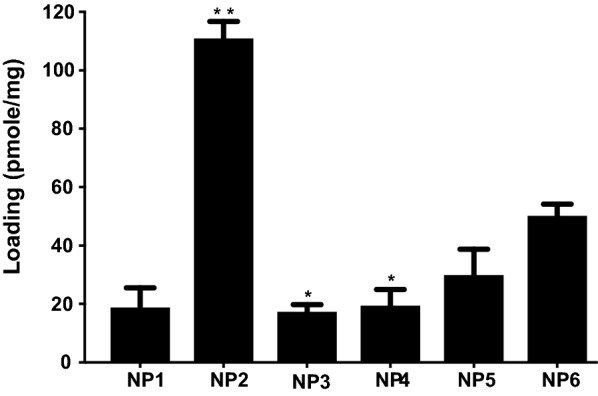
Nucleic acid loading analysis results. Loading of antimiR PS-155 nucleic acids in different grade PLGA nanoparticles. See Table 1 for description of NP1-NP6. Data are shown as mean ± standard error. (SE), n = 3. *p < 0.05)

Nucleic acid loading analysis results. Loading of antimiR PS-155 nucleic acids in different grade PLGA nanoparticles. See Table 1 for description of NP1-NP6. Data are shown as mean ± standard error. (SE), n = 3. *p < 0.05)