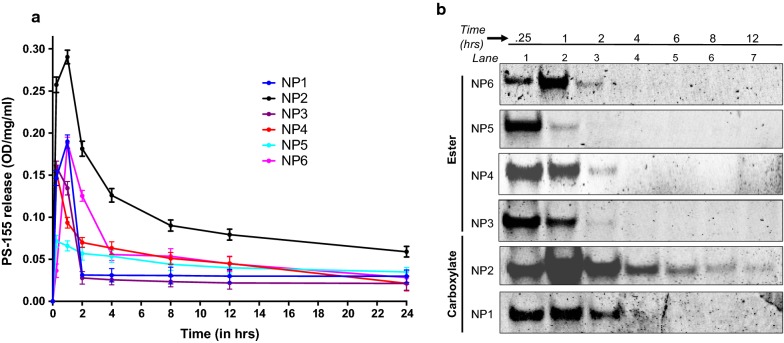
Fig. 3.
Nucleic acid release profile studies. a Release profile data of antimiR-155 PS nucleic acid from PLGA NPs at indicated time points in a graph. All data were collected in triplicate (n = 3) and error reported as mean ± standard error (SE). b Electrophoretic mobility gel shift assay to quantify the release of antimiR-155 PS from PLGA nanoparticles at indicated time points. The samples were separated on 10% nondenaturing polyacrylamide gel and stained with SYBR-Gold

