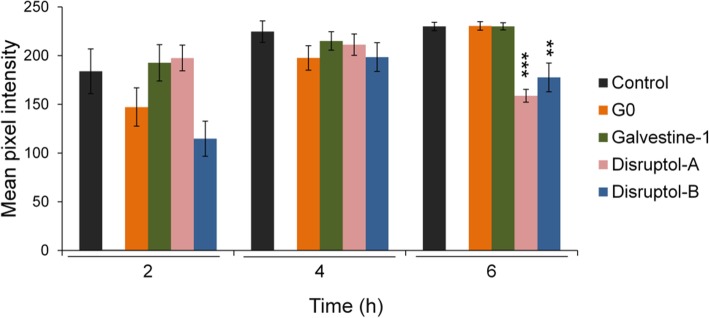
Fig. 3.
Effect of the compounds on anion superoxide (O2•-) production. Mean pixel intensity of NBT staining after 2, 4 and 6 h of treatment. For mean pixel intensity, pictures were transformed as grayscale images, a mark was drawn from the tip to 30 μm behind and the region of Interest, ROI, was manually selected using freehand selection tool. The mean value of the pixel intensity was obtained with the measure tool of the Image J software. Data represent the mean of (6 ≤ n ≤ 14 pollen tubes) from 2 biological replicates ± SEM. Asterisks indicate significant differences (*** P < 0.001, ** P < 0.01 and * P < 0.05) from the control DMSO 0.3% according to pairwise comparison using Dunnett’s test analysis (for 2 h and 4 h) and according to pairwise comparison using Wilcoxon’s test analysis with Holm adjustment (for 6 h) with R software according to parametric and non-parametric batch of time dataset

