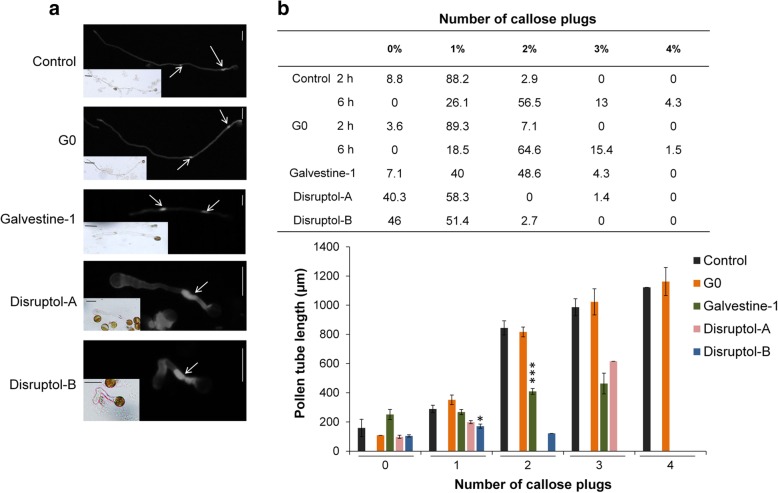
Fig. 4.
Effect of the compounds on callose plug deposition after 6 h of treatment. a Cytochemical staining of callose with DAB showing callose plugs (white arrows). b Distribution (%) of the number of callose plugs in treated pollen tubes and its relation with the mean length of pollen tubes. Data represent the mean (40 ≤ n ≤ 98 pollen tubes) from two biological replicates ± SEM. For the controls (DMSO and G0), data are a combination of pollen tubes grown for 6 h and 2 h, in order to get shorter pollen tubes. Asterisks indicate significant differences (*** P < 0.001, ** P < 0.01 and * P < 0.05) from the control DMSO 0.3% according to pairwise comparison using Wilcoxon’s test analysis with Holm adjustment with R software according to batch of callose plugs number dataset. Scale bar = 40 μm

