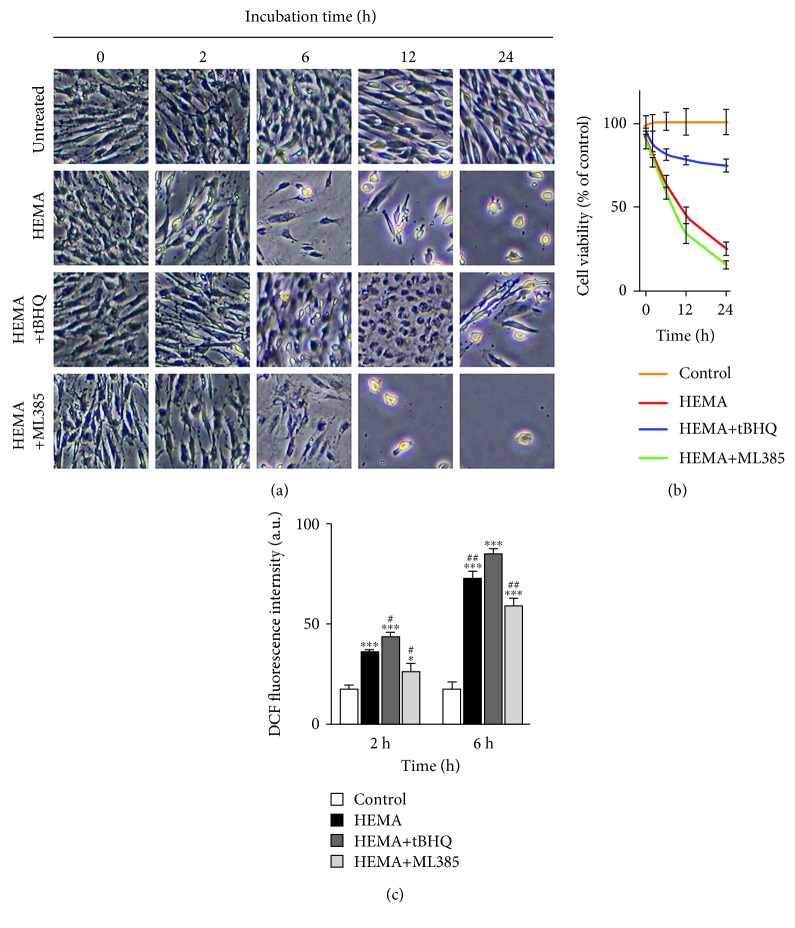
Figure 2.
HEMA-induced cell death and ROS accumulation is related to Nrf2 expression. (a) Visualization of hDPC viability observed by phase-contrast microscopy. (b) Viability of hDPCs as examined by CCK-8 assay after 24 h. (c) Intracellular ROS level examined by flow cytometry after a 2 h or 6 h exposure period. Data represent mean ± standard deviations (n = 3). ∗P < 0.05, ∗∗P < 0.01, and ∗∗∗P < 0.001 vs. untreated cells (control group); #P < 0.05, ##P < 0.01, and ###P < 0.001 vs. HEMA-treated cells. Data were analyzed using one-way analysis of variance (ANOVA) and post hoc Tukey test.

