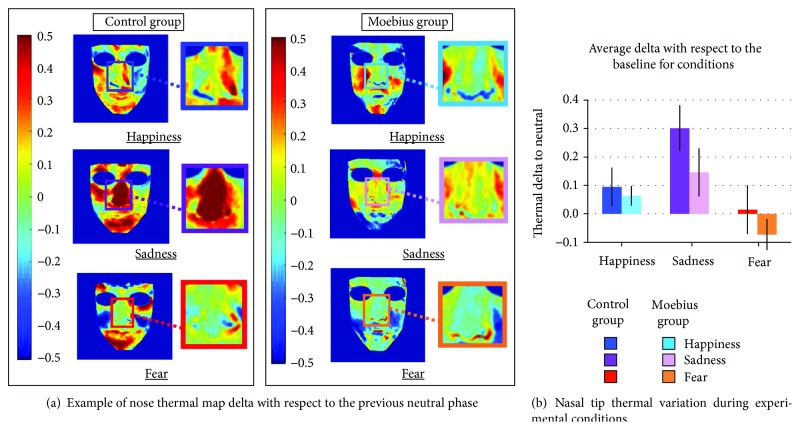
Figure 3.
(a) Thermal modulation in an example control participant and Moebius patient during the “happiness,” “sadness,” and “fear” conditions. In the figure, the inlays present the entire nasal area, but elliptic nasal tip ROIs were used for analyses (A = 297 pixels; MajorAxisLength = 20.35 pixels; MinorAxisLength = 18.64 pixels) [62, 65]. The control participant shows stronger thermal variation during the sadness condition than the Moebius patient. (b) Mean temperature values during each of the experimental conditions, baseline-corrected with respect to the neutral condition. Both control and Moebius participants show a significant nasal tip temperature increase during the “sadness” condition (∗p ≤ 0.001). Means and standard errors (SE) are reported for each condition in both control and Moebius groups.

