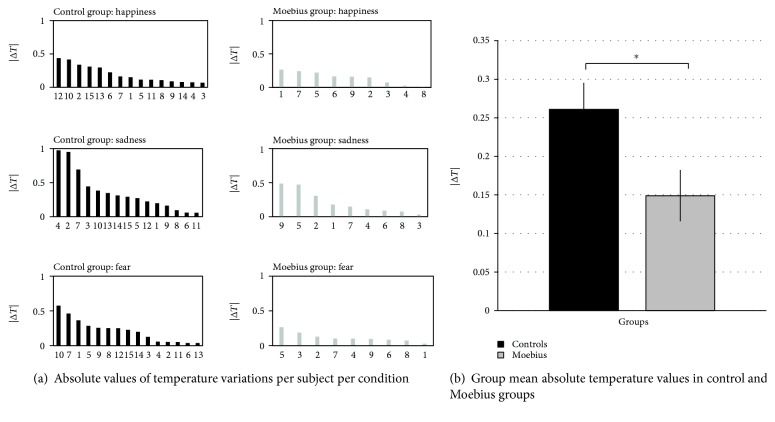
Figure 4.
(a) Absolute value of the change in temperature from baseline per participant during each of the experimental conditions. Moebius participants exhibit a lower thermal modulation compared with control participants. (b) Group mean absolute temperature values in control and Moebius participants. Control participants have significantly more intense thermal modulation compared with Moebius participants. Means and standard errors (SE) are reported for both control and Moebius groups.

