Figure 8.

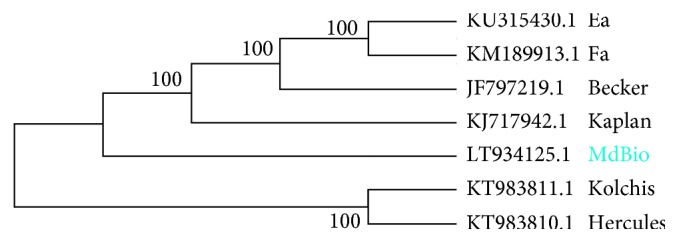
Evolutionary analysis by maximum likelihood method. The evolutionary tree was generated using whole-genome sequences. This analysis involved 7 nucleotide sequences. There were a total of 148,466 positions in the final dataset.

Evolutionary analysis by maximum likelihood method. The evolutionary tree was generated using whole-genome sequences. This analysis involved 7 nucleotide sequences. There were a total of 148,466 positions in the final dataset.