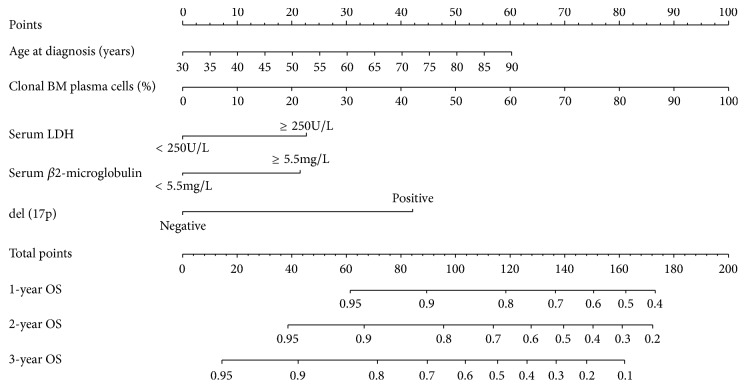
Figure 1.
Nomograms for the prediction of the 1-, 2-, and 3-year overall survivals in patients with newly diagnosed multiple myeloma. To use the nomogram, first, the position of each variable on the corresponding axis should be found. Next, a line to the points axis for the number of points should be drawn. Then, the points from all the variables should be added. Finally, a line from the total points axis should be drawn to determine the overall survival probabilities at the lower line of the nomogram. Abbreviations: BM, bone marrow; LDH, lactate dehydrogenase; OS, overall survival.

