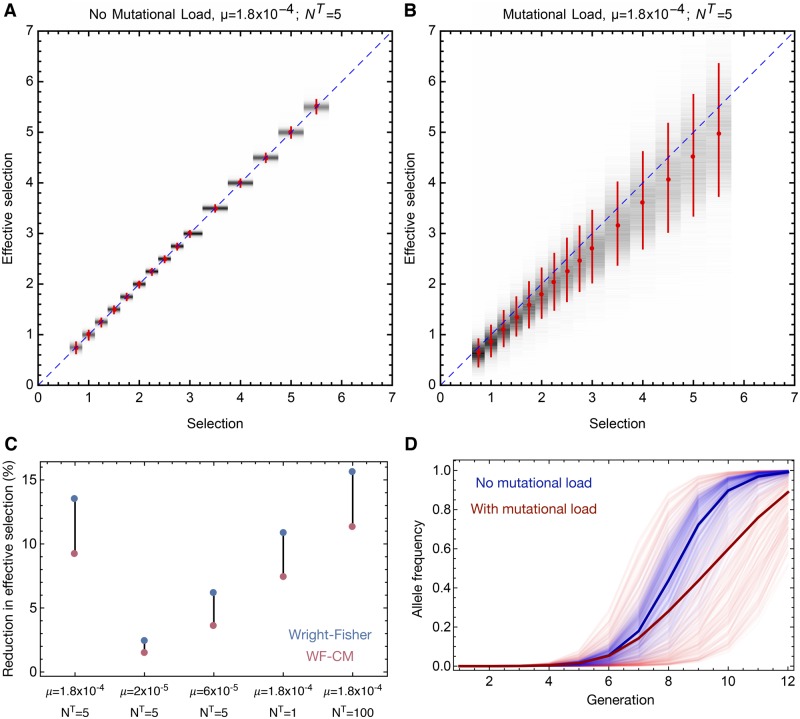
Figure 4.
(A) Effective selection coefficients for beneficial mutations in simulations which excluded mutational load and were conducted using default model parameters. Red dots show the mean effective selection for mutations with a range of inherent selection coefficients. Vertical red bars show 90 per cent confidence intervals for the effective selection. Grey shading represents the distribution of inferred effective selection values. The blue dotted line shows equivalence between the true and effective selection coefficients. (B) Effective selection coefficients in simulations which included mutational load and were conducted using default model parameters. (C) Reduction in the mean effective selection coefficient relative to the inherent value of selection under different model parameters. Values are shown for simulations conducted with the Wright-Fisher (blue) and WF-CM (red) models. (D) Example trajectories for the beneficial variant under the WF-CM model with (red) and without (blue) mutational load. Selection here is equal to 3. Bold lines indicate mean trajectories. Trajectories shown here are those in which the beneficial variant is first observed in the third generation of the simulation.

