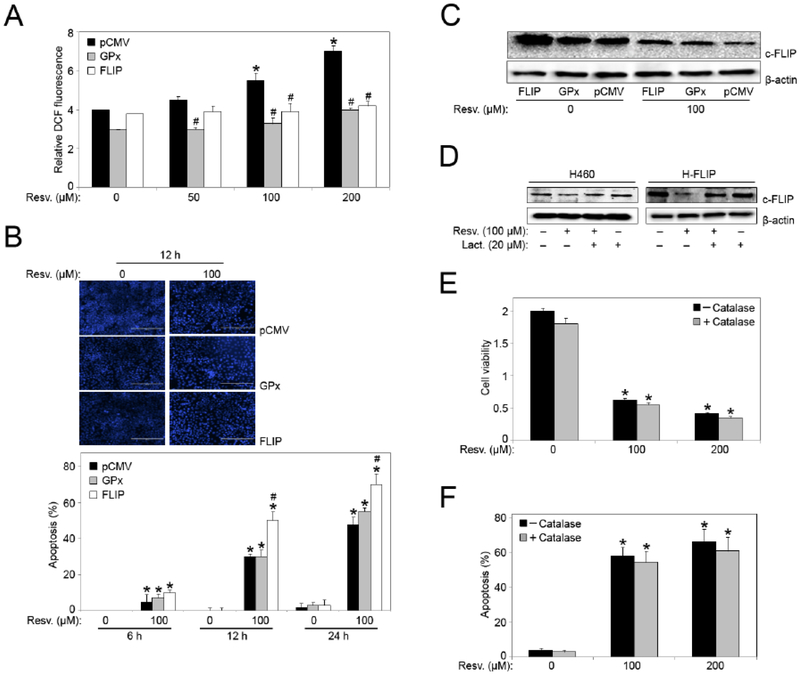
Fig. (4).
Effects of GPx and c-FLIP overexpression on resveratrol-induced apoptosis and ROS generation. (A) Hydrogen peroxide levels were analyzed in FLIP-, GPx- and mock-transfected (pCMV) H460 cells by Spectrofluorometric measurement of DCF fluorescence after 1 hour treatment with resveratrol. *, p < 0.05 versus non-treated control. #, p < 0.05 versus pCMV transfected cells. (B) FLIP-, GPx- and mock-transfected (pCMV) H460 cells were treated with resveratrol (0–200 μM) for 6, 12, and 24 hour time points and analyzed for apoptosis by Hoechst 33342 assay. Representative fluorescence micrographs of stained cells treated for 12 hours. *, p < 0.05 versus non-treated control. #, p < 0.05 versus pCMV and GPx transfected cells. Data are mean ± S.E.M (n≤4). (C) FLIP-, GPx- and mock-transfected (pCMV) H460 cells were treated with resveratrol (100 μM) for 12 hours and analyzed for c-FLIP protein expression by Western blotting. All blots were reprobed with β-actin antibody for loading control. Representative blots from three or more independent experiments is shown. (D) H460 and FLIP cells were pre-treated with lactacystin (proteasome inhibitor) for 1 hour before treatment with resveratrol (100 μM) for 12 hours and analyzed for c-FLIP protein expression by Western blotting. All blots were reprobed with β-actin antibody for loading control. Representative blots from three or more independent experiments is shown. (E) FLIP cells were treated with resveratrol (0–200 μM) for 24 hours in the presence or absence of Catalase 1000 (U/μl) and cell viability was assessed by MTT assay. (F) FLIP cells were treated with resveratrol (0–200 μM) for 12 hours in the presence or absence of Catalase 1000 (U/μl) and analyzed for apoptosis by Hoechst 33342 assay. Graphs represent relative fluorescence intensity over untreated control. Data are mean ± S.E.M (n≤4). *, p < 0.05 versus non-treated control.

