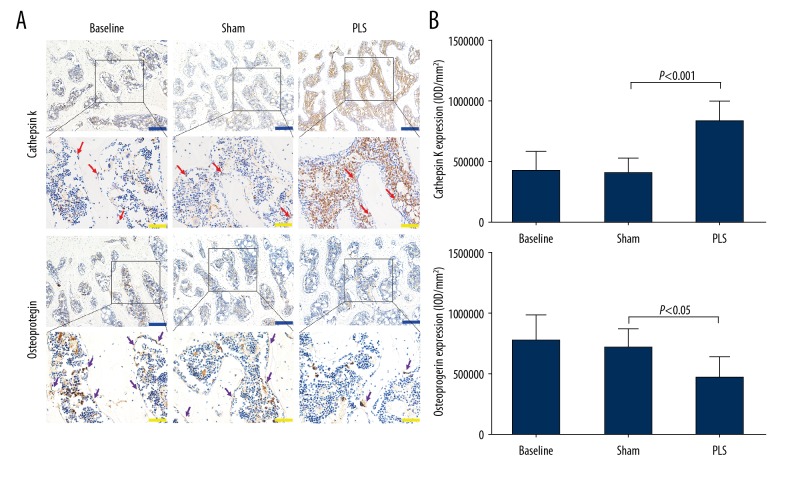
Figure 9.
Photomicrographs of the immunohistochemistry for cathepsin K and osteoprotegerin (OPG) of the patella and trochlea induced by patellar ligament shortening (PLS) surgery in the rat model of patellofemoral joint osteoarthritis (PFJOA). (A) Representative immunohistochemical images of both cathepsin K and osteoprotegerin (OPG) in the subchondral bone. (B) The quantified protein levels of cathepsin K and OPG in the subchondral bone. The red arrow indicates the expression of cathepsin K-positive-stained cells. The purple arrow indicates the expression of OPG-positive cells. Blue bars=200 μm. Yellow bars=50 μm. Data are expressed as the mean ± standard deviation (SD).

