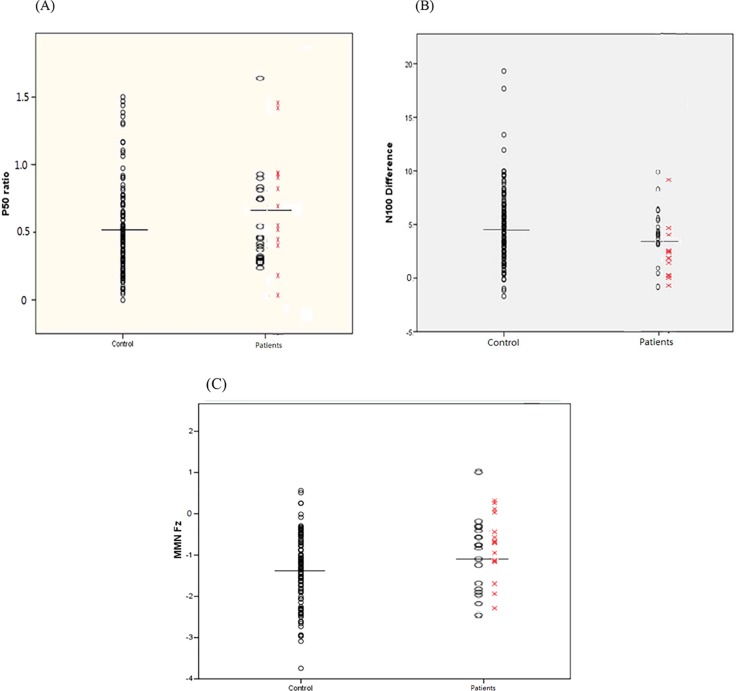
Figure 1.
P50 ratios (S2 amplitude/S1 amplitude) (A), N100 differences (μV; S2 amplitude − S1 amplitude) (B), and mismatch negativity (MMN) at electrode Fz (C) of individual participants between groups. The horizontal lines indicate the mean values within control vs. patient group, while the patient group consists of ultra-high-risk (UHR; oval) and first-episode psychosis (FEP; X) subjects. For P50 and N100, a larger ratio (S2/S1) and a smaller difference (S1 − S2) indicate poorer sensory gating. For MMN, a larger (less negative) value indicates poor deviance detection.

