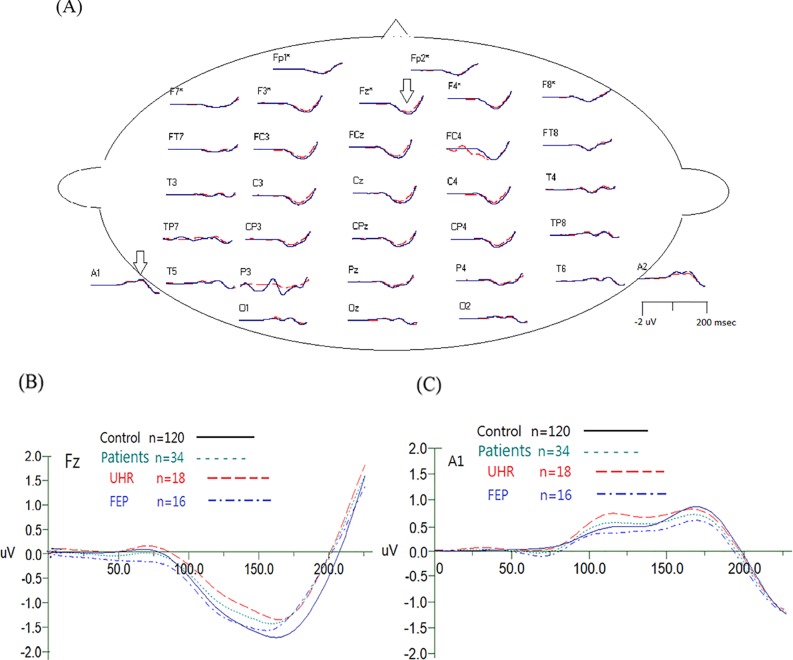
Figure 2.
(A) Demonstrated grand average MMN waveforms for healthy control subjects (in blue) and patients (in red). The arrows indicated the waveform reversed in polarity at the mastoid electrodes, which is typical for MMN. A close-up of grand average waveform at electrode Fz and A1 (mastoid) electrodes is shown in (B) and (C).

