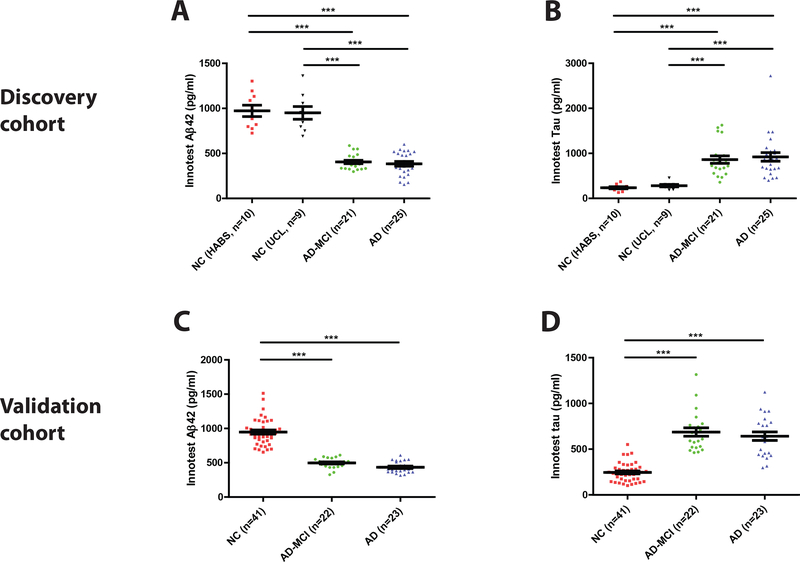
Figure 2. CSF biomarkers of AD concur with the clinical diagnosis of subjects in the Discovery and Validation cohorts.
(A and C) Aβ42 and (B and D) tau were measured in CSF using validated INNOTEST ELISAs. In the Discovery Cohort, approximately equal numbers of healthy control subjects were from two distinct sources the HABS study (NC HABS) and the UCL study (NC UCL). Subjects with AD biomarker positive-mild cognitive impairment (AD-MCI) and AD biomarker positive-clinical AD were from the UCL study. The NC, AD-MCI and AD groups in the Validation Cohort were all from the UCSD study. Each point is the average of duplicate measurement for a single individual, and group means ± SEM are indicated. Differences between groups were assessed with Kruskal-Wallis H test followed by Dunn’s post-hoc test. Aβ42 levels were lower in the AD-MCI and AD groups than in the NC groups, whereas tau levels were elevated in the AD-MCI and AD groups. n.s., non-significant; p>0.05; *** p<0.001.

