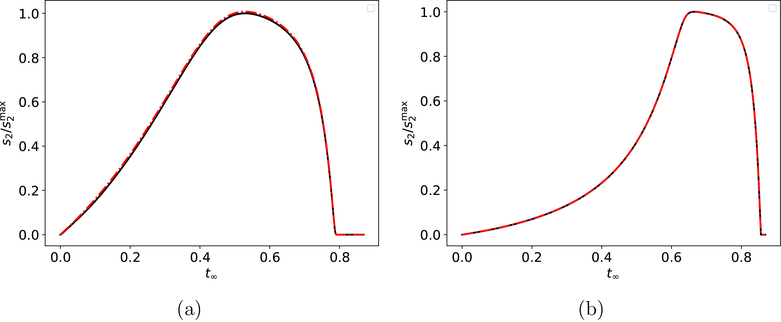
Figure 4: The validity of the composite solution for slow indicator reactions in the reaction mechanism (1)–(2).
The solid black curve (barely visible) is the numerical solution to the mass action equation (6), and the dashed/dotted red curve is the numerical solution to the composite solution (35). In panel (a), the initial conditions (without units) are: , k1 = 1, k2 = 100 and k-1 = 1. , k3 = 1, = 0, k2 = 1 and k−3 = 1. In panel (b), the initial conditions (without units) are: , k1 = 1, k2 = 100 and k-1 = 1. , k3 = 1, k2 = 1 and k-3 = 1 The substrate concentrations in (a) and (b) has been scaled by their maximum values, and time has been mapped to the t∞ scale: t∞(t) = 1 − 1/ln(t + e).

