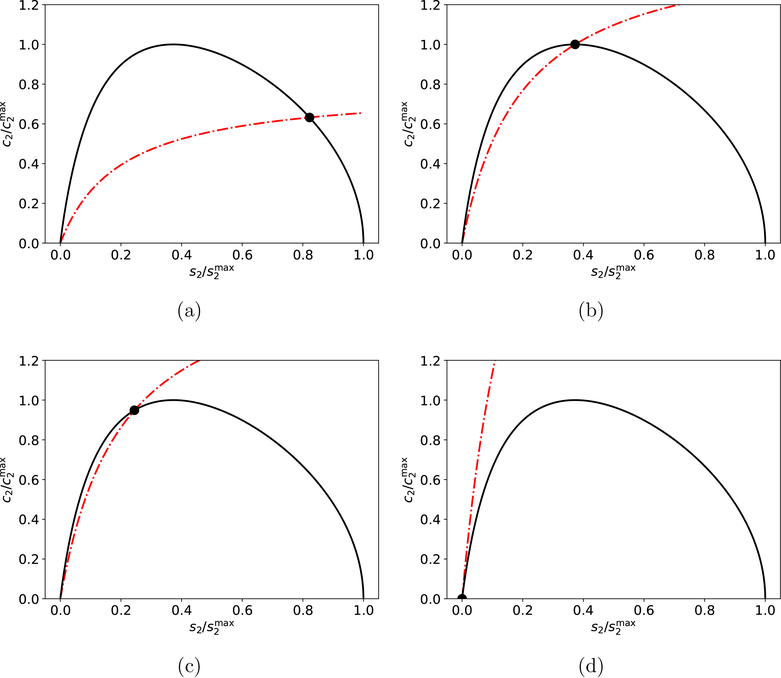
Figure 5: Visualization of the Laelaps manifold in the phase–plane of the reaction mechanism (3)–(4).
The solid black curve is the numerical solution to the mass action equations (36). The solid black dot is the numerical solution to (36) at various points in time; the dashed/dotted red curve is the corresponding location of the c2–nullcline. Initially, the solution lags just behind the c2–nullcline (panel (a)). Eventually, the solution catches the c2–nullcline (panel (b)), and then lies just above for the duration of the reaction (panel(c)). Panel (d) is the location of the c2–nullcline upon completion of the indicator reaction. A dynamical representation of the Laelaps manifold is shown in Movie 2 (Supplementary Materials). The constants (without units) used in the numerical simulation are: , k1 = 1, k2 = 1 and k−1 = 1. , k3 = 1, k4 = 100 and k−3 = 100. The substrate (s2) and complex (c2) concentrations have been scaled by their maximum values.

