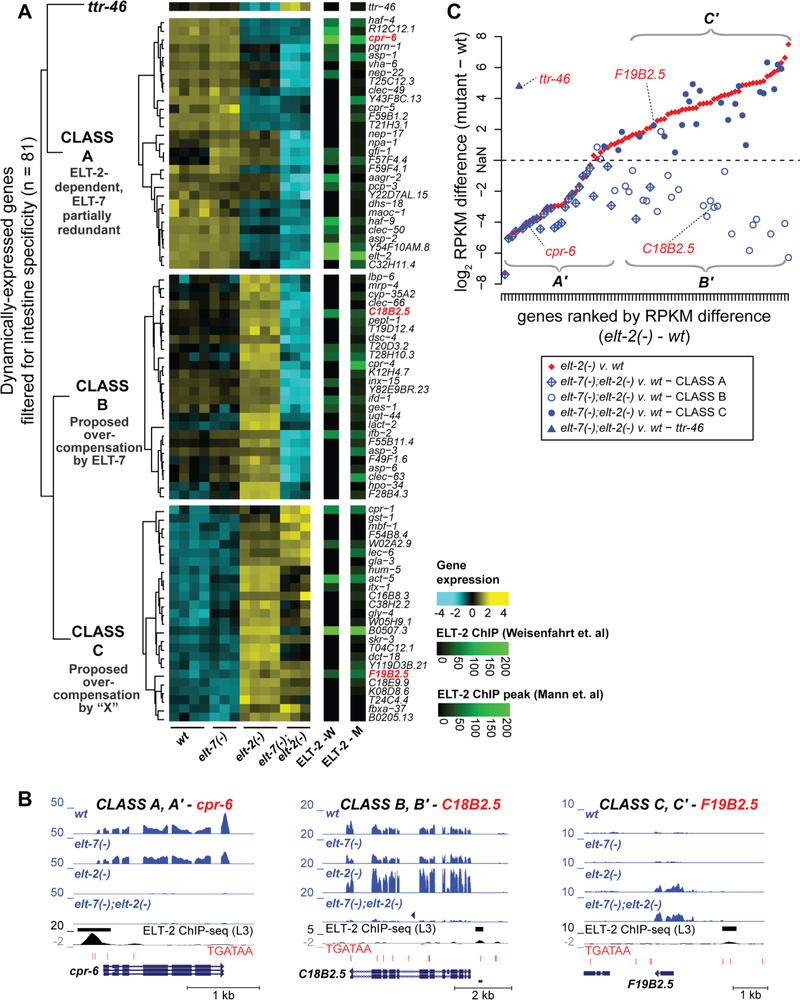
Fig. 4. Intestine-specific genes cluster into three main classes based on their response to loss of ELT-2 and subsequent loss of ELT-7.
A. The set of dynamically expressed genes (n = 3092) were filtered for those previously shown to be specifically expressed in the intestine and not in any other tissue (n = 81). Hierarchical clustering of their transcriptome dynamics was performed using Euclidean distances of row-means-normalized log-stabilized read counts. This effort identified three major classes of genes (Class A, Class B, and Class C) containing roughly equal numbers of members. ELT-2 ChIP-seq peak scores associated with these genes, as identified in two independent studies (Mann et al., 2016; Wiesenfahrt et al., 2016), are displayed to the right of the heat map.
B. Representative genome browser images are shown for the Class A gene cpr-6, the Class B gene C18B2.5, and the Class C gene F19B2.5. For each genome browser image, the normalized mapped read counts for all four conditions (wild type, elt-2(−), elt-7(−), and the double mutant elt-7(−);elt-2(−)) are shown. For each of the three representative genes, ELT-2 ChIP-seq peaks and peak regions (Wiesenfahrt et al., 2016) are shown, together with the incidence of TGATAA motifs and the gene models.
C. Deviations of transcript levels (RPKM) from wild-type is shown for elt-2(−) mutants and elt-2(−) elt-7(−) double mutant strains for the 81 intestine-specific dynamically changing genes (identified in Fig. 4A). Three classes of intestine-specific genes (A’, B’, C’) can be distinguished on the basis of their response to loss of ELT-2 and subsequent loss of ELT-7. RPKM differences between the elt-2 and wildtype are plotted in rank order (red points) beginning with the greatest decrease in transcript levels in the elt-2(−) mutant at rank # 1 and proceeding to the greatest increase in transcript levels in the elt-2(−) mutant at rank # 81. Keeping the same rank order as the x-axis, the difference in RPKM between the elt-7(−); elt-2(−) double mutant and the wildtype is then plotted for the same gene (blue points). The differences in RPKM are plotted as the signed log2(Absolute Value(RPKMfor mutant – RPKMfor wildtype control)), where the sign is negative for genes whose expression decreases upon loss of ELT-2 and positive for those genes whose expression increases. Because of this logarithmic transformation, the zero point is undefined. The different blue symbols map the different data points to membership of Class A,B or C genes on Fig. 4A.

