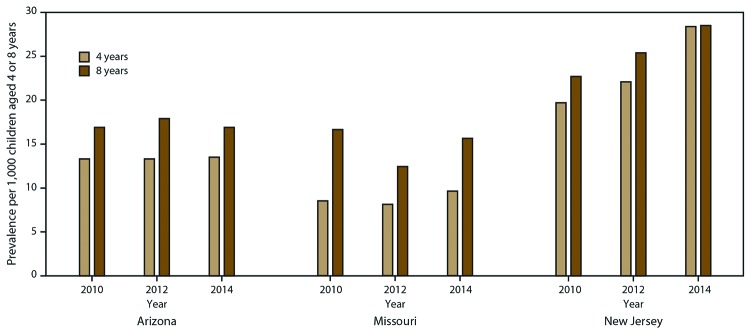
FIGURE 2.
Trends in autism spectrum disorder prevalence* among children aged 4 years and 8 years — Early Autism and Developmental Disabilities Monitoring Network, three sites, United States, 2010, 2012, and 2014
* In Arizona in 2012, the prevalence among children aged 4 years and children aged 8 years was significantly different (p<0.05 for chi-square test). In Missouri, the prevalence was significantly different in all 3 years. (In New Jersey, no differences were significant in any years.)

