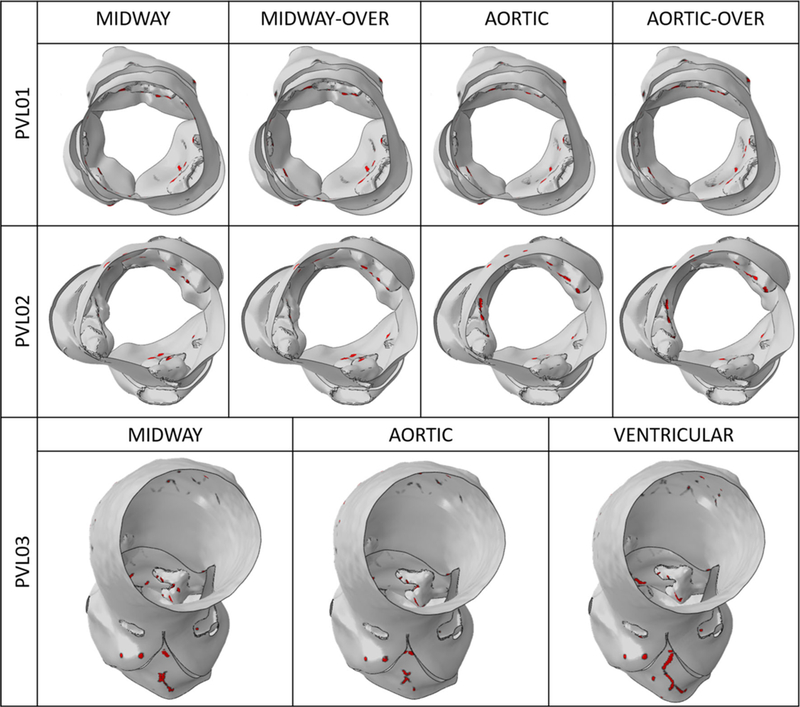
Fig. 7.

Contact area distribution on the inner sinus and ventricular side of the AV leaflets for the three cases at the end of the stent recoil/relaxation phase. Bottom view for PVL01 and PVL02 showing more circular distribution of the contact area (top and mid row). Frontal/top view for PVL03 showing concentration of contact area on bulky calcific deposit in the non-coronary leaflet (bottom row)
