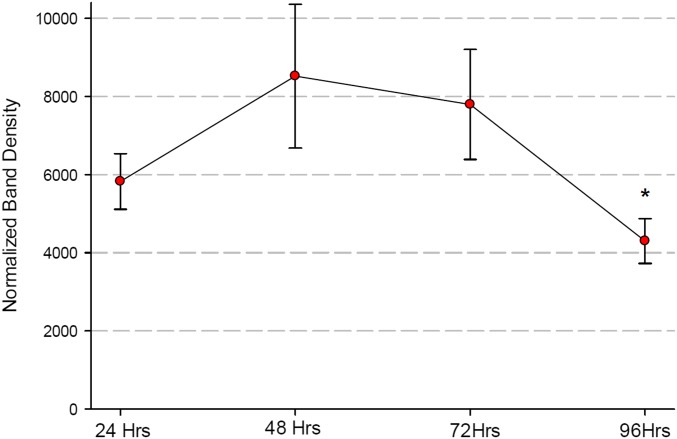
FIGURE 5.
Time course of VP40 expression in CACO-2 cell layers. Cell layers were harvested at indicated times after transfection from Millicell PCF inserts, and whole-cell lysates were prepared as described in Materials and Methods. Results shown represent the densitometry of VP40 bands in Western immunoblots, each data point representing the mean of 4 cell layers per condition ± se. One-way ANOVA. *P < 0.05 vs. 48-h time point.

