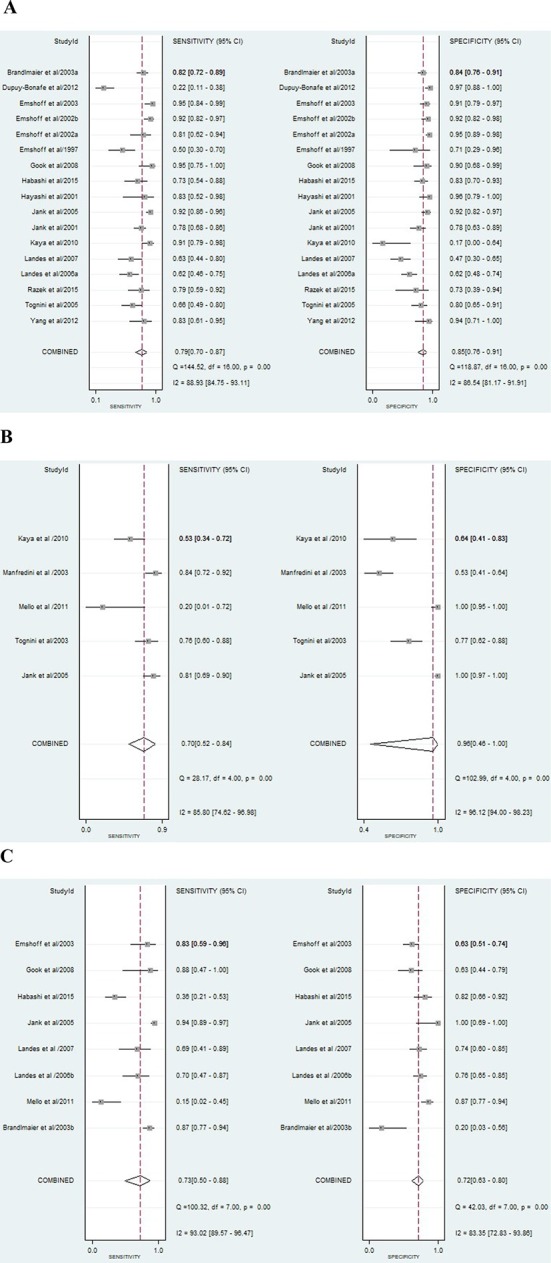
Figure 3.

Forest plot with the diagnostic test accuracy (DTA) of each study (sensitivity, specificity and 95% confidence interval) and heterogeneity assessment. (A) Forest plot with the diagnostic test accuracy (DTA) for US to DD assessment; (B) Forest plot with the diagnostic test accuracy (DTA) for US to JE assessment; (C) Forest plot with the diagnostic test accuracy (DTA) for US to CC assessment.
