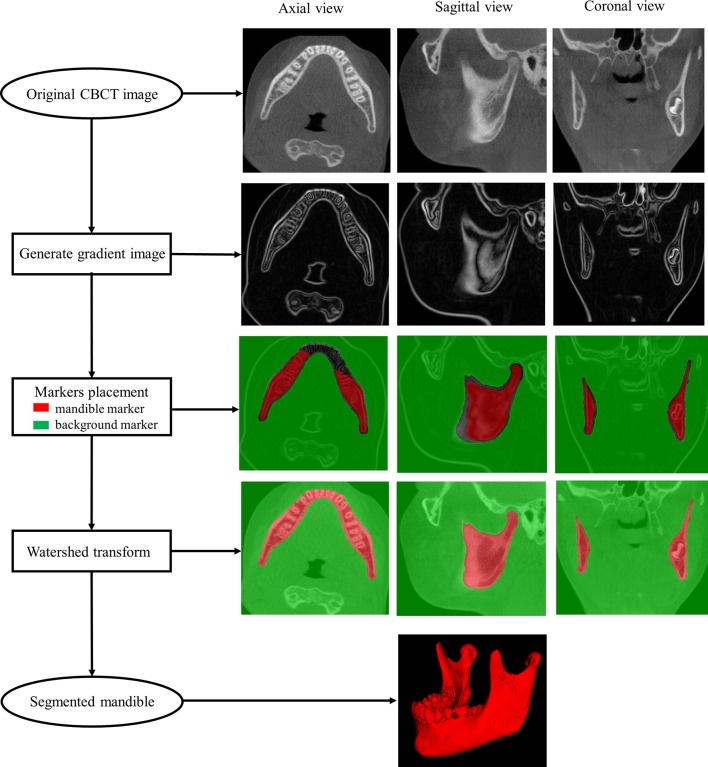
Figure 1.
Illustration of the marker-based watershed transform method. The original image is transformed into the gradient image which highlights boundaries of sharply changing intensity in the original image. The mandible marker (in red) and the background marker (in green) are placed within the mandible and at the rest of the structures, separately. The watershed transform floods the gradient image by dilating the markers simultaneously until colliding at watershed lines, estimating the mandible boundary. The segmented mandible is reconstructed in below. The pipeline is demonstrated in axial (column 1) sagittal (column 2) and coronal (column 3) views.

