
Figure 2. Phenotypic Characterization of mouse M370I Treg cells.
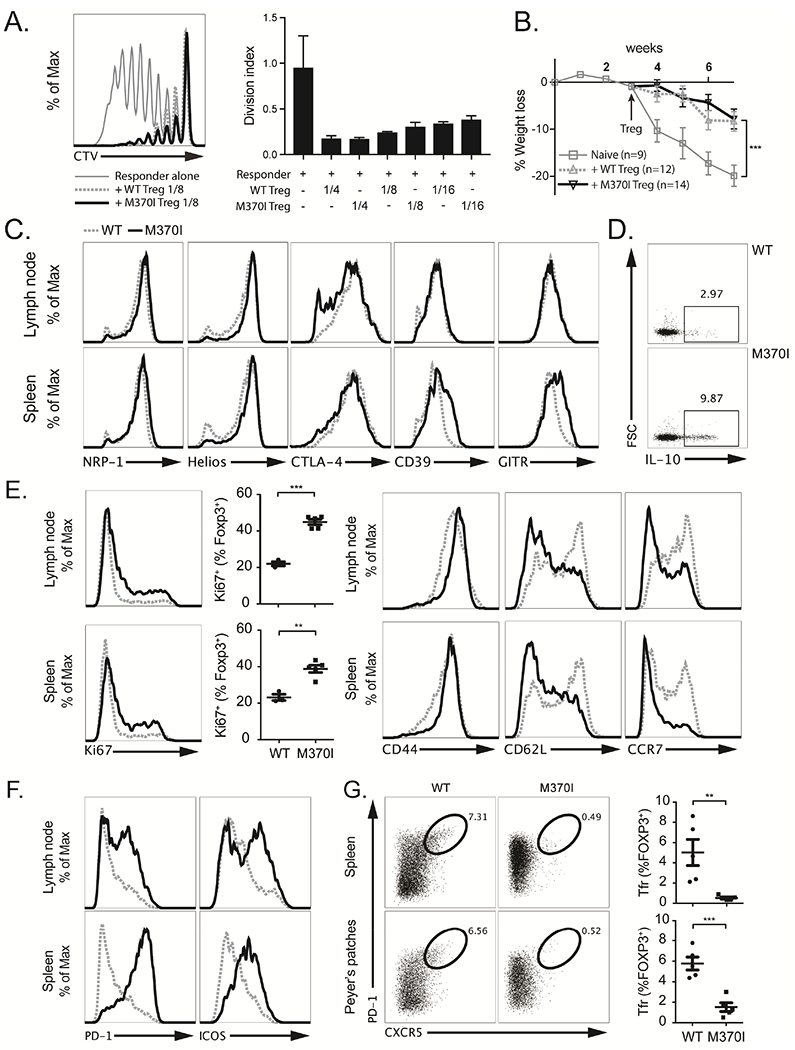
(A) Representative histograms of three independent experiments (left panel) depicting Celltrace Violet (CTV) dilution profile of responder CD4+ T cells cultured alone (thin grey line) or with either wild-type Treg cells (dashed grey line) or M370I Treg cells (black line) at a ratio of 1:8 (Treg cells:responders). Quantification (right panel) of the in vitro suppression assay by the division index at different Treg cell:responder ratios. (B) Weight loss (as a percentage of starting weight) over time after injection of naïve CD4+ T cells into immunodeficient Rag1−/− mice followed by WT or M370I Treg cells three weeks later. At the time of Treg injections, mice were randomly assigned to the three experimental groups. Error bars depict ±SEM, Two-way ANOVA test: naïve T cells/naiïve T cells + WT Tregs; week 7 (P < 0.001), naïve T cells/naiïve T cells + M370I Tregs; week 7 (P < 0.001). (C) Phenotypic analysis of Treg cells from LNs or spleen from wild-type (dashed grey line) and M370I littermates (black line) by staining for indicated proteins at 6-12 weeks of age. (D) Representative intracellular staining for IL-10 after PMA-ionomycin activation of splenic Treg cells from wild-type and M370I littermates at 6-12 weeks of age. (E) Flow cytometric analysis for proliferation (Ki67) and activation (CD44, CD62L and CCR7) markers on Treg cells from LNs and spleen from wild-type and M370I littermates. Expression and quantification from mice analyzed between 6 and 12 weeks of age. (F) Representative histograms for PD-1 and ICOS expression on Treg cells from LNs and spleen from wild-type and M370I littermates at 6-12 weeks of age (G) Representative flow cytometric analysis (left panel) and quantification (right panel) of Tfr cells in spleen and peyer’s patches from 6-12-week-old wild-type and M370I littermates. All data points reflect individual biological replicates (error bars depict ±SD, unless otherwise stated).