
Figure 3. M370I Treg cells acquire Th2-like phenotype.
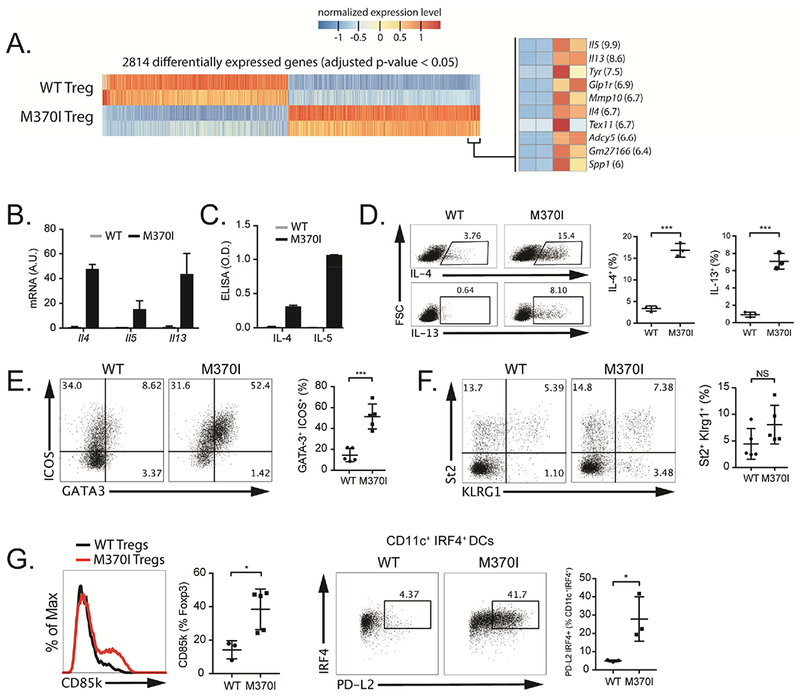
(A) RNA-seq analysis, heat map representation of differentially expressed genes between wild-type and M370I Treg cells from LNs and spleen from 3-week-old wild-type and M370I littermates mice. (left panel) most enriched DEGs in the M370I Treg (right panel, fold-change between WT and M370I Treg is shown in parenthesis). (B) Quantification by RT-qPCR of the expression of Il4, Il5 and Il13 in wild-type and M370I Treg cells. (C) Quantification by ELISA of IL-4 and IL-5 secreted by wild-type and M370I Tregs cells after overnight PMA-ionomycin activation. (D) Representative flow cytometric analysis (left panel) and quantification (right panel) of IL-4 and IL-13 producing Treg cells from PMA-ionomycin activated LNs from wild-type and M370I mice. (E) Representative flow cytometric analysis (left panel) and quantification (right panel) of Th2-like Treg cells (GATA3+ICOS+) present in the LNs from wild-type and M370I mice. (F) Characterization (left panel) and quantification (right panel) of St2 and KLRG1 expression on LNs Treg cells from wild-type and M370I mice. (G) Flow cytometric analysis and quantification (left panel) of CD85k expression in splenic Treg cells from wild-type and M370I mice. Representative flow cytometric analysis (right panel) and quantification of CD11c+MHCII+PD-L2+IRF4+ splenic DCs from wild type and M370I mice. Expression and quantification of results from mice analyzed between 6 and 12 weeks of age, unless otherwise stated. All data points reflect individual biological replicates (error bars depict ±SD) and representative of at least three independent experiments.