
Figure 5. M370I Foxp3 mutation increased E-P interactions at Foxp3 target genes.
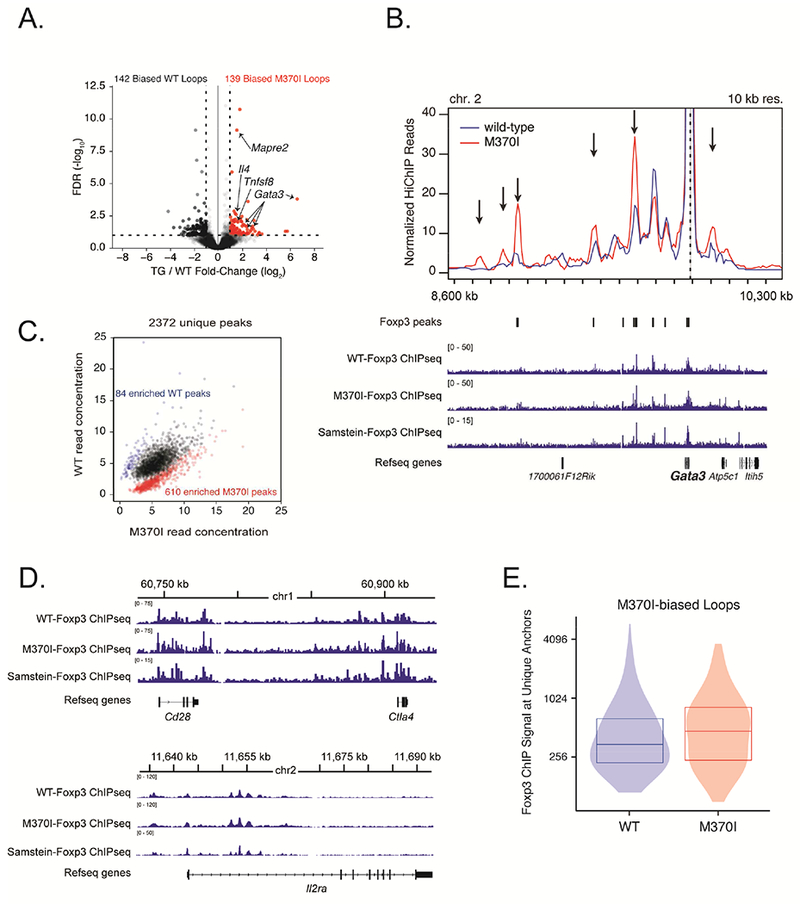
(A) Volcano plot of H3K27ac-HiChIP loops differentially expressed between wild-type and M370I Treg cells; M370I-biased loops are labelled in red (log2 (fold change) >1 and false discovery rate (FDR) <0.05). (B) Virtual 4C interaction profile at the Gata3 promoter in wild-type (blue line) and M370I (red line) Treg cells. Representative plots of Foxp3 ChIP-seq reads from wild-type and M370I Treg cells aligned to the genomic region containing Gata3 gene (bottom panel). Arrows indicated M370I-biased loops. Wild-type and M370I-Foxp3 ChIP-seq peaks are localize on the plot. (C) Scatterplot of normalized read for each peak region identified by Foxp3 ChIP-seq in either WT or M370I Treg cells. Each point represents a Foxp3 binding site; differentially bound sites are labelled in blue for the wild-type enriched sites (84 peaks) and in red for the M370I enriched sites (610 peaks). (D) Representative plots of Foxp3 ChIP-seq reads from wild-type and M370I Treg cells aligned to the genomic region containing Cd28 and Ctla4 genes (top panel) or Il2ra gene (bottom panel). (E) Quantification of Foxp3 ChIP-seq signal at unique M370I-biased loops anchors in wild-type and M370I Treg cells. See also Figures S5, S6, Tables S1, S2 and S3.