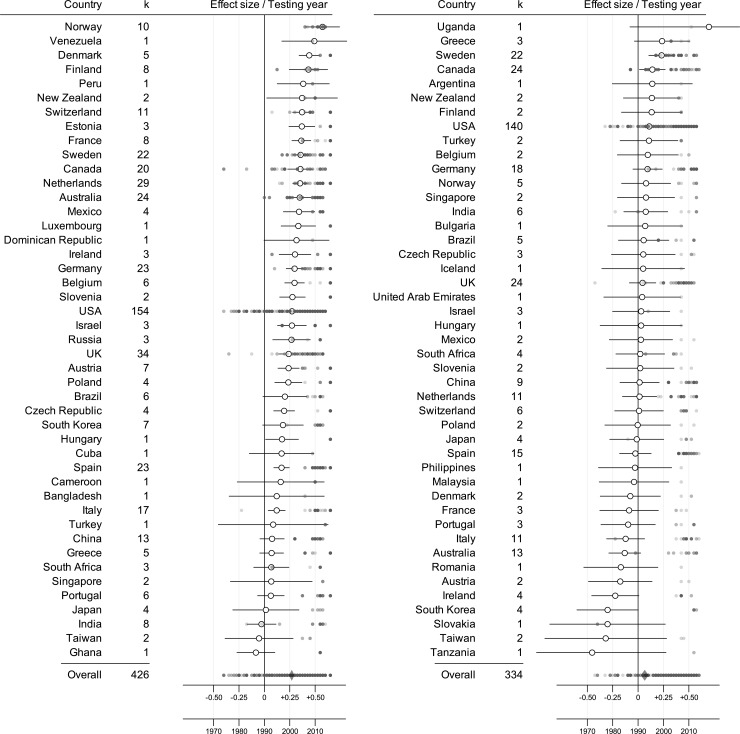
Fig 1. Effect size estimates for each country for both task categories.
Forest plot describing the variation in sex differences in (a) Verbal and (b) Other episodic memory tasks across the (a) 45 and (b) 45 countries used in the analyses, with k = number of studies available for each country. Cohen’s d (unfilled circles) is presented on the x-axis, with error bars describing the 95% confidence intervals (notice that some error bars have been truncated). Filled circles indicate the year each study was carried out.

