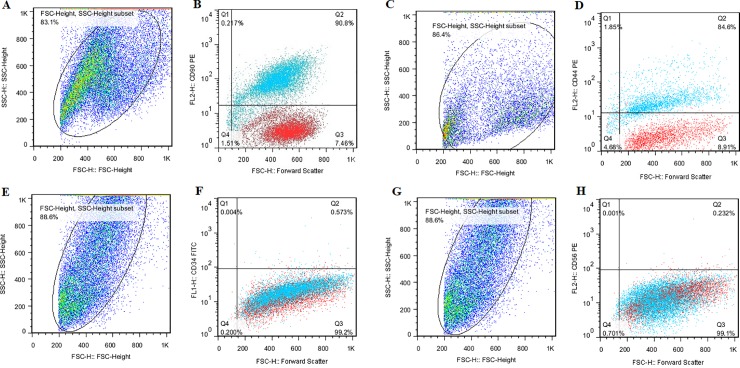
Fig 3. The expression of the cell surface markers of bone marrow derived-MSCs that analyzed by flow cytometry.
Each cell surface marker was tested individually by separate cell population distributions and the isotopes controls were used as the negative control in this experiment; (A) a total population of cells for CD90 evaluation, (B) the bone marrow derived-MSCs were positive for CD90 (90.8%), (C) a total population of cells for CD44 evaluation, (D) the bone marrow derived-MSCs were positive for CD44 (84.6%), (E) a total population of cells for CD34 evaluation, (F) the bone marrow derived-MSCs were negative for CD34 (0.57%), (G) a total population of cells for CD56 evaluation, (H) the bone marrow derived-MSCs were negative for CD56 (0.23%). For CD34 and CD56, the isotype control was mouse IgG1 and for CD90 and CD44, the isotype control was mouse IgG2b. Also, isotype control is seen with red dots.

