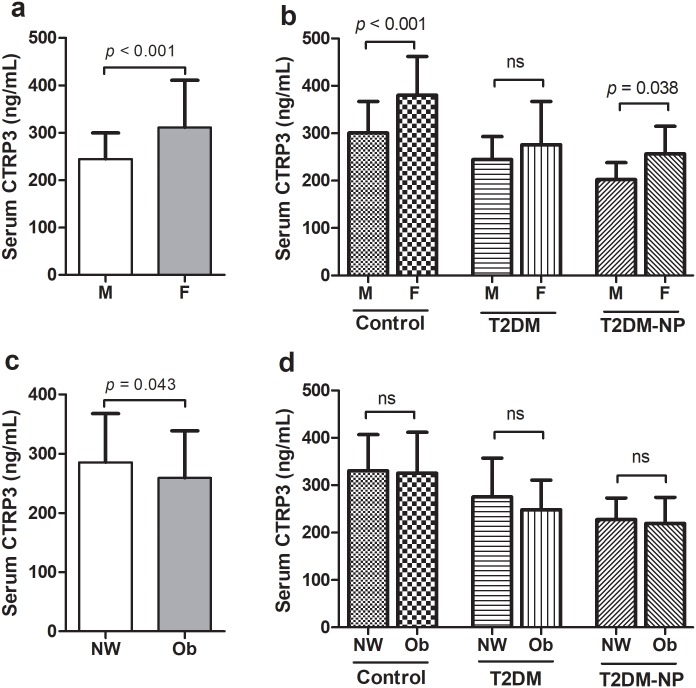
Fig 2. Serum levels of CTRP3 stratified by sex and BMI.
a) Serum levels of CTRP3 stratified by sex, b) Serum levels of CTRP3 stratified by sex in the each group, c) Serum levels of CTRP3 stratified by BMI and d) Serum levels of CTRP3 stratified by BMI in each group. M: Male, F: Female, NW: Normal weight and Ob: Obese.

