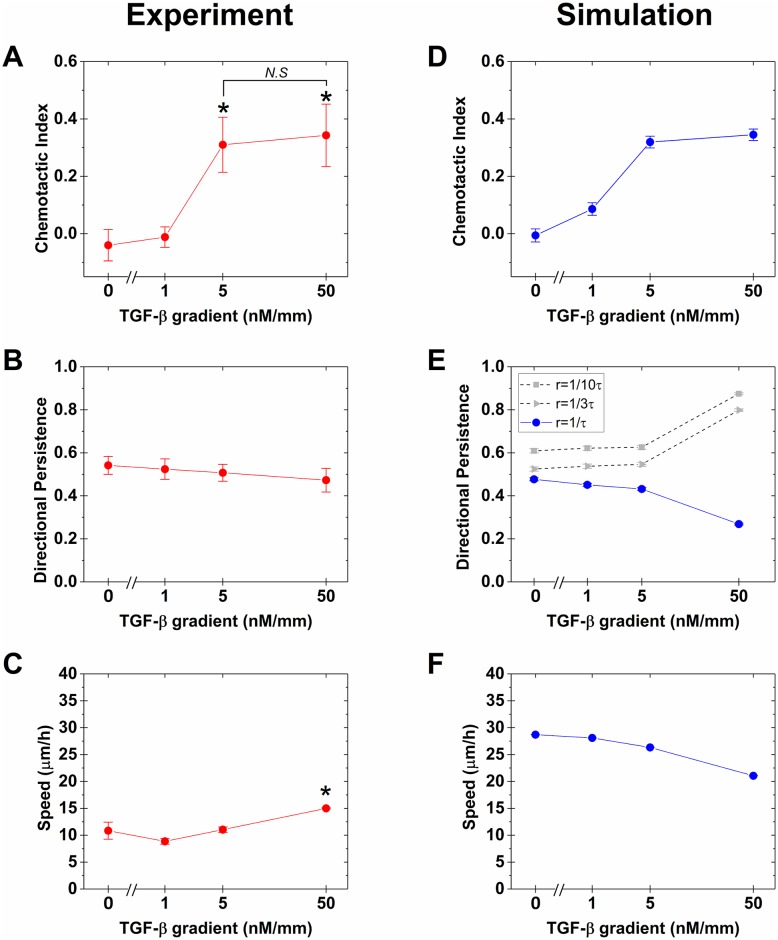
Fig 4. Comparison of experiments with simulations.
Experimental (A) chemotactic index, (B) directional persistence, and (C) speed for four different TGF-β gradients, g = 0, 1, 5, and 50 nM/mm.(red) Data points indicate average and standard error of medians from three different experiments. A, B, and C are plotted with log-scaled TGF-β gradient. (D-F) Same for cellular Potts model (CPM) simulations (blue). Error bars are standard error from 1000 trials. Directional persistence from reduced polarization memory decay rate(r) is represented in (E) (gray).

