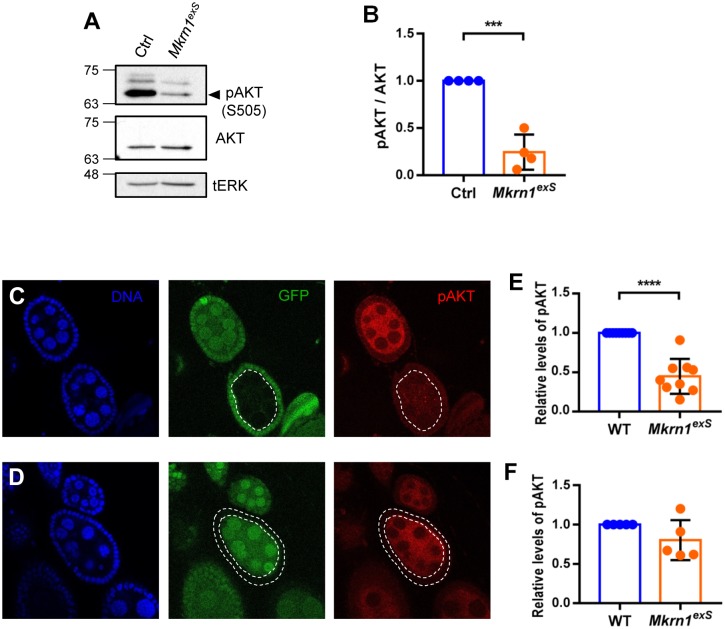
Fig 4. p-AKT levels were reduced in Mkrn1exS ovaries.
(A) Protein extracts were prepared from ovaries of one-day-old control and Mkrn1exS female flies and analyzed by western blot using anti-p-AKT and anti-AKT antibodies, and tERK as the loading control. (B) Relative p-AKT levels were quantified by measuring band intensities and normalized by total AKT protein levels. Error bars represent SEM from four independent experiments. Asterisks indicate statistically significant differences (Student’s t-test: ***P<0.001). (C–F) Confocal images of immunostaining for p-AKT (red) and DNA (blue) of ovaries from Mkrn1exSflies containing mutant germline and follicle cells. Mkrn1exS cells are distinguished by the absence of GFP (green). p-AKT level were significantly reduced in Mkrn1exS germline cells, but not in Mkrn1exS follicle cells. Fluorescence intensities of p-AKT were quantified and Mkrn1exS germline cysts were compared with similarly sized neighboring wild-type germline cysts. Mkrn1exS follicle cells were quantitated and compared to nearby wild-type follicle cells. Error bars represent SEM for 10 germline clones and five follicle clones. Asterisks indicate statistically significant differences (Student’s t-test: *P < 0.05; ****P < 0.0001).

