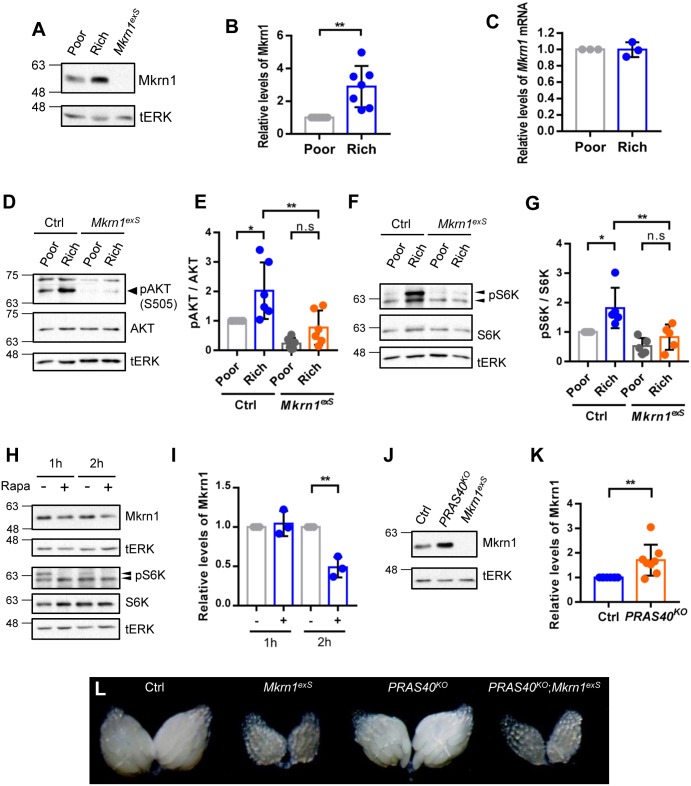
Fig 5. Mkrn1 ovarian protein levels are regulated by nutritional status and TOR signaling in Drosophila.
(A) Newborn female flies were reared for 24 hours under the indicated nutritional conditions. Protein extracts from flies under nutrient-poor or -rich conditions were subjected to immunoblot analysis using anti-Mkrn1 antibody, and tERK as the loading control. (B) Mkrn1 protein levels were quantified by measuring band intensities and the relative levels are shown. Error bars represent SEM from seven independent experiments. Asterisks indicate statistically significant differences (Student’s t-test: **P<0.0.01). (C) Ovaries from flies under the same nutrient conditions were used for mRNA extraction. Quantitative real-time PCR was performed to measure Mkrn1 mRNA levels and the relative levels are shown. Error bars represent SEM from three independent experiments. (D-G) Control and Mkrn1exS females were reared under nutrient-poor or -rich conditions for 24 hours. Protein extracts were then obtained from the ovaries and subjected to immunoblot analysis using anti-p-AKT and anti-AKT antibodies (D), anti-pS6K and anti-S6K (F) and tERK as the loading control. Relative levels of p-AKT (E) and pS6K (G) were quantified by measuring band intensities and normalized to the total AKT protein levels (E) and S6K protein levels (G). (H and I) The ovaries were dissected and incubated in PBS with or without rapamycin (1μM) for the indicated time. Protein extracts from the ovaries were subjected to immunoblot analysis using anti-Mkrn1 antibody and tERK as the loading control. Relative levels of Mkrn1 were determined as described above. The error bars represent SEM from three independent experiments and the asterisks indicate statistically significant differences (Student’s t-test: **P<0.01). (J and K) Ovaries from control and PRAS40KO female flies were dissected and subjected to western blot analysis of the Mkrn1 levels using anti-Mkrn1 antibody and tERK as the loading control. Relative levels of Mkrn1 were determined as described above. The error bars represent SEM from eight independent experiments and the asterisks indicate statistically significant differences (Student’s t-test: *P<0.05, **P<0.01). (L) Bright filed images of ovaries from control, Mkrn1exS, PRAS40KO, and Mkrn1exS PRAS40KO flies are shown.

