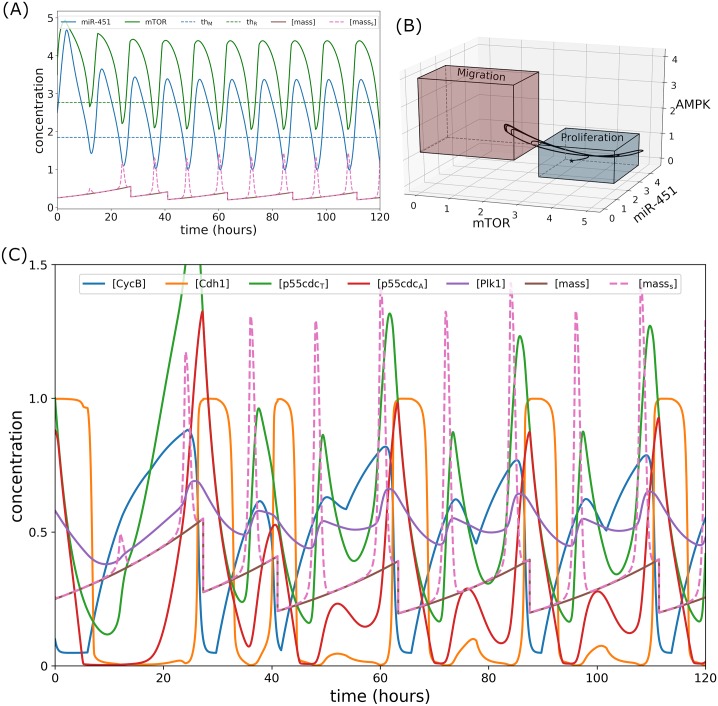
Fig 8. Intracellular dynamics under regular glucose and drug infusions.
(A) Concentration profiles of miR-451 (M) and mTOR (R) fluctuating around the threshold values under regular infusions. Peaks in pseudo-mass are generated when M and R crosses thM and thR, respectively. (B) Trajectory of mTOR–miR-451–AMPK concentration profiles switching between proliferation and migration mode. (C) Dynamics of intracellular proteins, mass, and masss of the cell cycle model in response to regular glucose and drug infusions.

