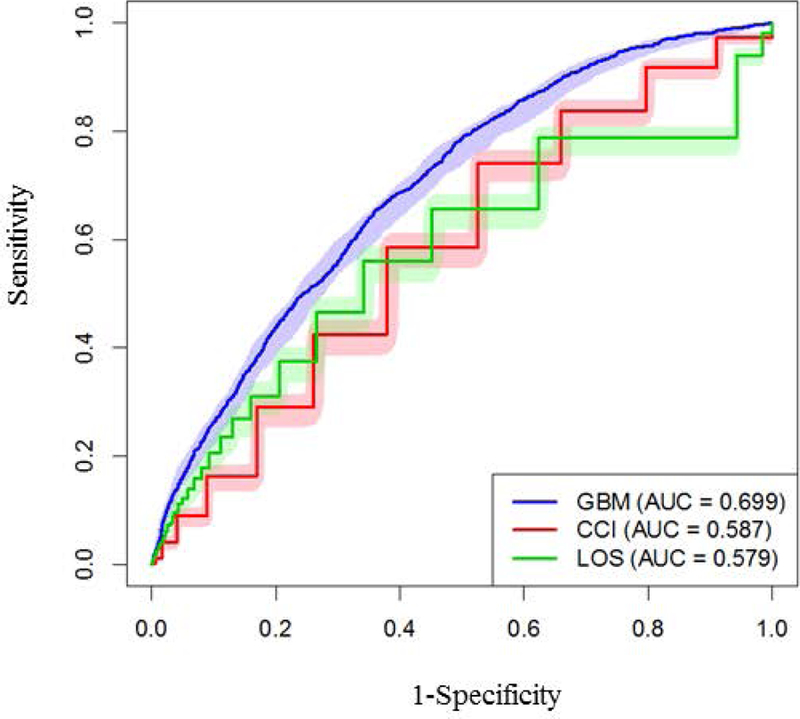
Figure 2.

Performance results for the GBM model, Charlson Comorbidity Index, and Length of Stay were compared by using corresponding ROC curves on out-of-sample observations via 10-fold cross-validation, along with 95% pointwise confidence bands (obtained via 1,000 bootstrap samples). AUC indicates area under the receiver-operator curve; CCI, Charlson Comorbidity Index; GBM, gradient boosting machine; LOS, length of stay; ROC, receiver operating curve.
