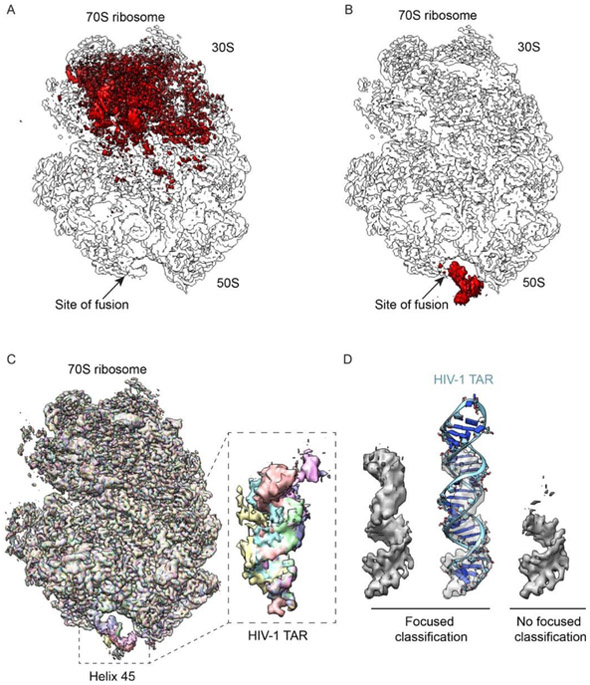
Figure 4-. Experimental reconstructions highlighting the use of focused classification to analyze highly heterogeneous datasets.
Bacterial 70S ribosomes containing an HIV-1 TAR element fused into Helix 45 (H45) were used to analyze different classification approaches. (A) Combinatorial pairwise differences between all 8 classes from global classification merged into a single volume to highlight the overall variability. (B) Same as A, but from the result of focused classification using 2-D masks, applied on the region of TAR fusion into H45. In both A-B, arrows denote the site of fusion. (C) Overlaid reconstructions after focused classification, highlighting the differences within the TAR element, but not in the rest of the ribosome. (D) Close-up of TAR reconstruction after deconvolving its mobility through focused classifications (left), shown also with a rigid-body docking of the TAR element into density (middle). A control reconstruction, without focused classification but using the same number of particles, is displayed alongside (right).

