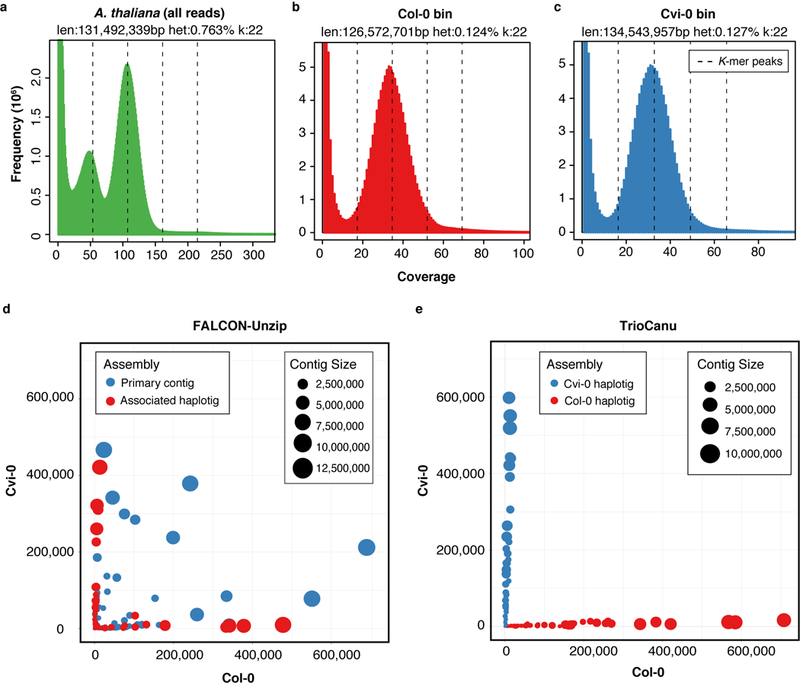
Figure 3. Read and assembly k-mer statistics for an Arabidopsis thaliana F1 hybrid.

a) GenomeScope 30 k-mer count distributions for the F1 PacBio data corrected by Canu, and partitioned by haplotype and corrected by TrioCanu for the b) Col-0 and c) Cvi-0 haplotypes. GenomeScope reports an estimated genome size and SNP heterozygosity based on a model fit to the histogram. The dashed lines show k-mer peaks identified by GenomeScope, from left to right they are the 1-copy (heterozygous), 2-copy (homozygous), 3-copy, and 4-copy (repeats). The k-mer distribution for all reads shows two clear peaks, characteristic of a diploid read set. In comparison, the binned PacBio data shows a normal k-mer count distribution, characteristic of a haploid read set. d) Counts of Col-0 (x-axis) and Cvi-0 (y-axis) haplotype-specific k-mers in FALCON-Unzip and e) TrioCanu contigs (colored circles). FALCON-Unzip primary contigs switch between haplotypes, resulting in a mix of k-mers from both parents, whereas the FALCON-Unzip associated haplotigs are smaller but preserve local phase information. In comparison, TrioCanu haplotigs contain sequence from only a single haplotype and are automatically sorted into two complete haplotypes.
